Octopus Compare
- Setting Up
- Comparing Data
- Understanding The Figures
- Missing Data
- Changing Comparison Products
- (Pro) Comparing Custom Dates And Ranges
- (Pro) Creating Custom Tariffs
- (Pro) Consumption Shifting
- Agile Rates
- Configuring Octopus Compare
Setting Up
Retrieving Your API Details
Octopus Compare relies on the Octopus Energy API, which is an interface that applications can easily access and retrieve data. The Octopus Energy API is freely available to anyone who would like to access their raw data, or other data related to Octopus Energy such as tariffs. The full details of the API can be found here, along with some examples of the responses: Octopus Energy v1 API
Some features of this API requires authentication to access data from your personal Octopus Energy account, which includes your meter information and consumption data. Rather than opting for an email and password, an 'API Key' is used which is randomly generated and can be refreshed whenever requested - this ensures that your email and password isn't available to 3rd party tools and in the case you believe someone is using your data, you can refresh your key. This key gives 'read-only' permissions to 3rd parties and doesn't have the ability to change details on your account.
Octopus Compare requires that you have a valid smart meter linked with your Octopus Energy account. Without a smart meter (SMETS1 or SMETS2), you will currently be unable to use the application as consumption data is not available via the API.
Retrieving your credentials
Accessing your credentials is easy. First head to the Octopus Energy Developer Dashboard and log in using your email and password. You will be greeted with a page as shown below, which will contain a section containing your API Key and Account Number. Further down the page you will also find the MPAN and Serial Number of your Electricity Meter (and Gas Meter if applicable).
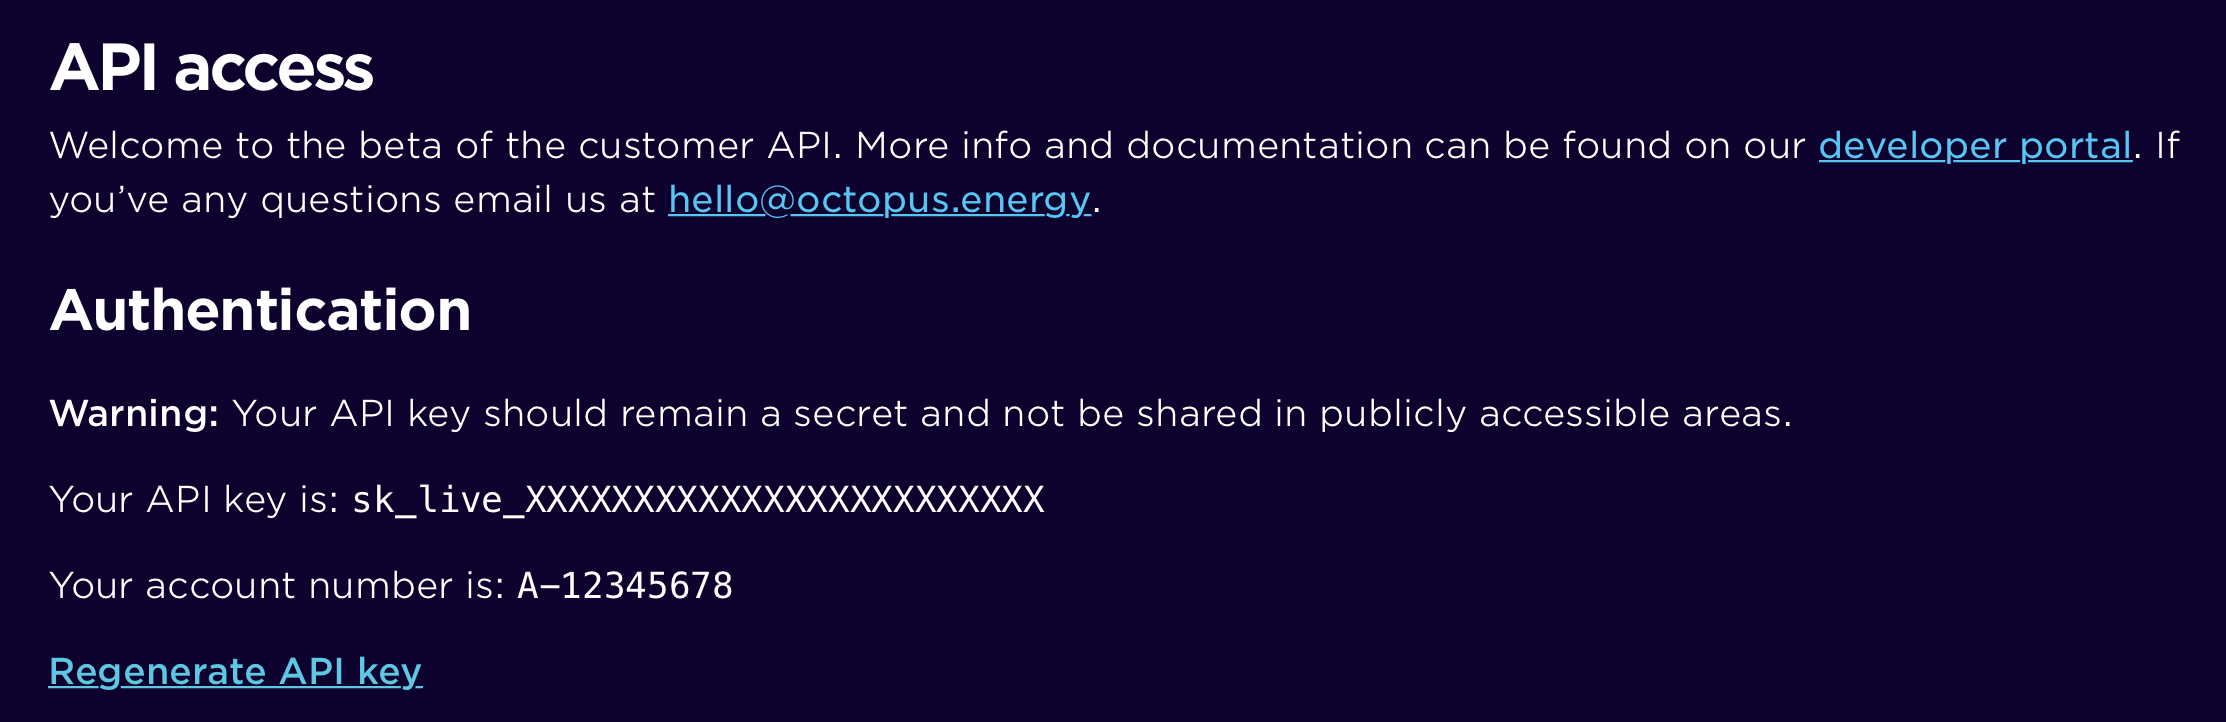
For now, keep this page open as Octopus Compare uses both your API Key and Account Number to retrieve your details.
Entering Your API Details
Now that you have your API Details from the Octopus Energy Dashboard, you can use these to begin setting up Octopus Compare.
We have made this process easy by only requesting both your API Key and Account Number - we'll do the rest. Copy both pieces of information into your Octopus Compare app. With your API Key in the first field and Account Number in the second, press 'Next'.

Choosing your meter
If successful, you will be presented with the next step in which you can selected the desired Electricity Meter that you would like to use with Octopus Compare. Don't worry if every field is greyed out, this just means that these are the only details available for those fields.
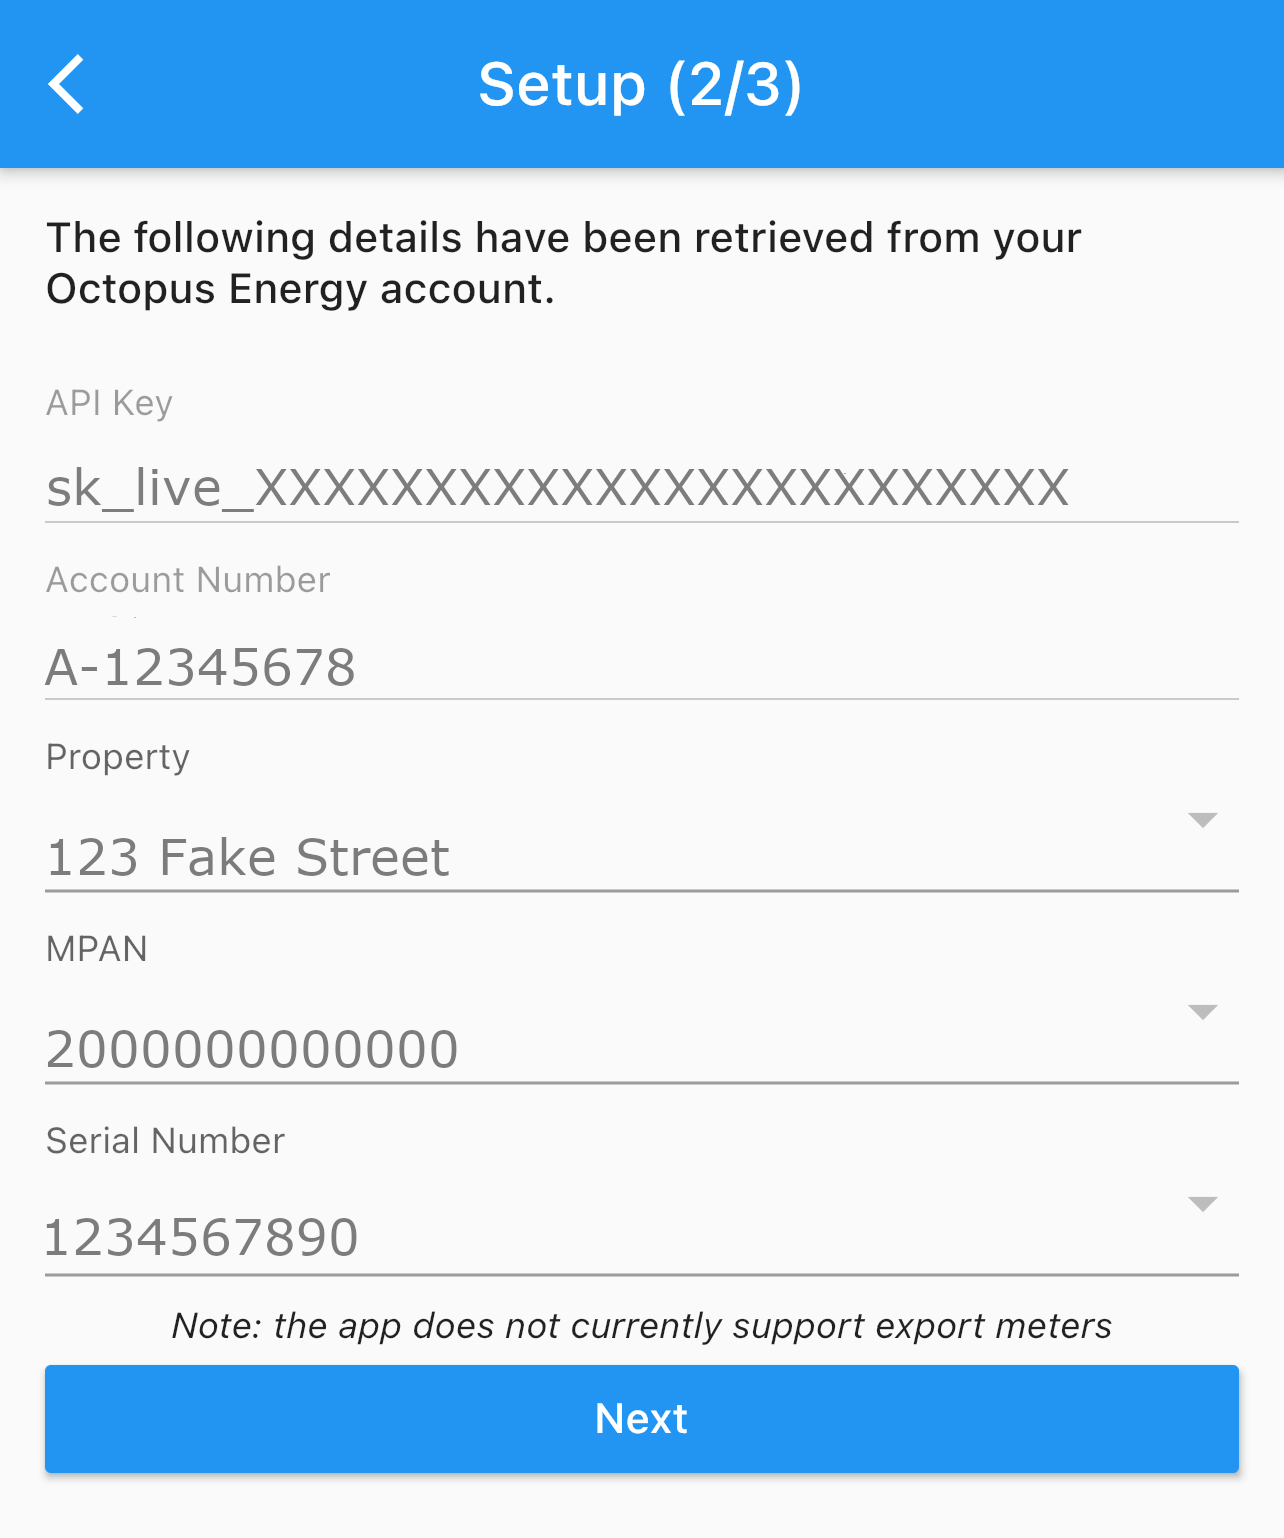
It isn't uncommon that you may have multiple serial numbers under a single MPAN. This can occur due to a new, upgraded meter or from a previous meter from a different energy supplier. If you do have multiple meters, select the one specified on the Octopus Energy Developer Dashboard.
Once all your details are correct in Step 2, you can press next. This will download any available consumption for your selected meter and allow you to begin selecting products in the final step.
Downloading Products
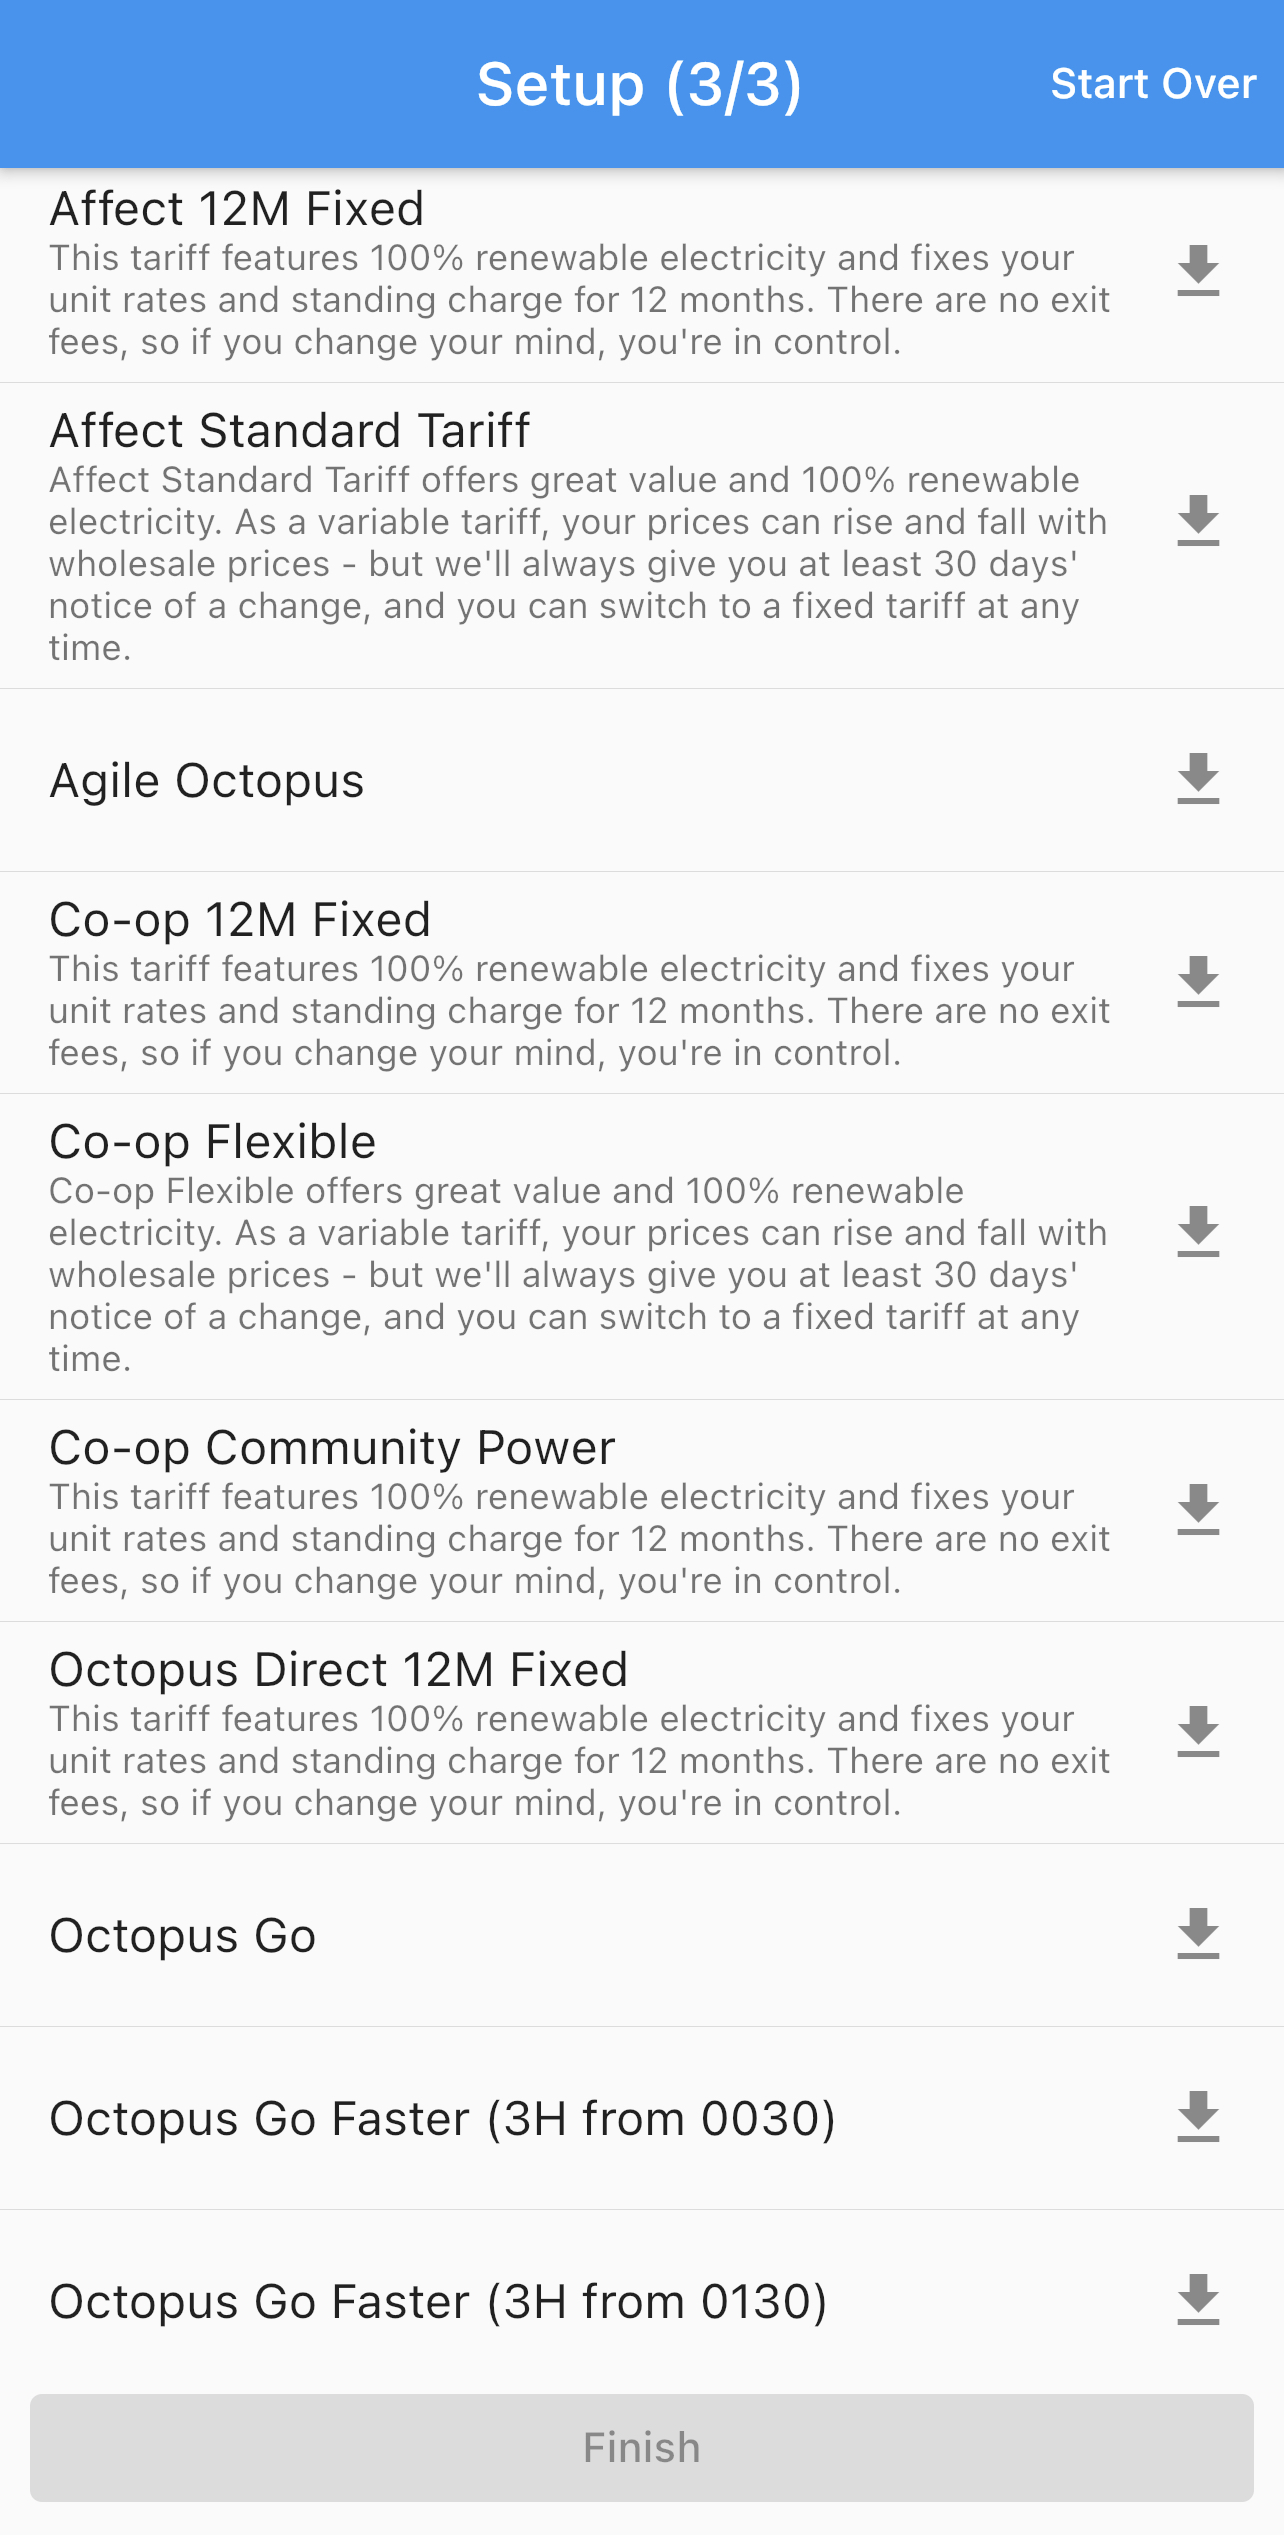
Now that all your consumption data has been retrieved, you can begin downloading products which can be used to compare against each other. Typically the most popular 2 tariffs are Agile Octopus and Octopus Go, but you can select any products that you would like. To complete this stage, you must select at least 2 products. You can always add or remove more products later within settings.
Once downloaded, you will see a visual confirmation in the form of a green checkmark next to the downloaded product. In the case that you receive an error, please get in contact with us at the using our contact form.
Downloading products can sometimes take a while and some products may take more storage space than others.
 |
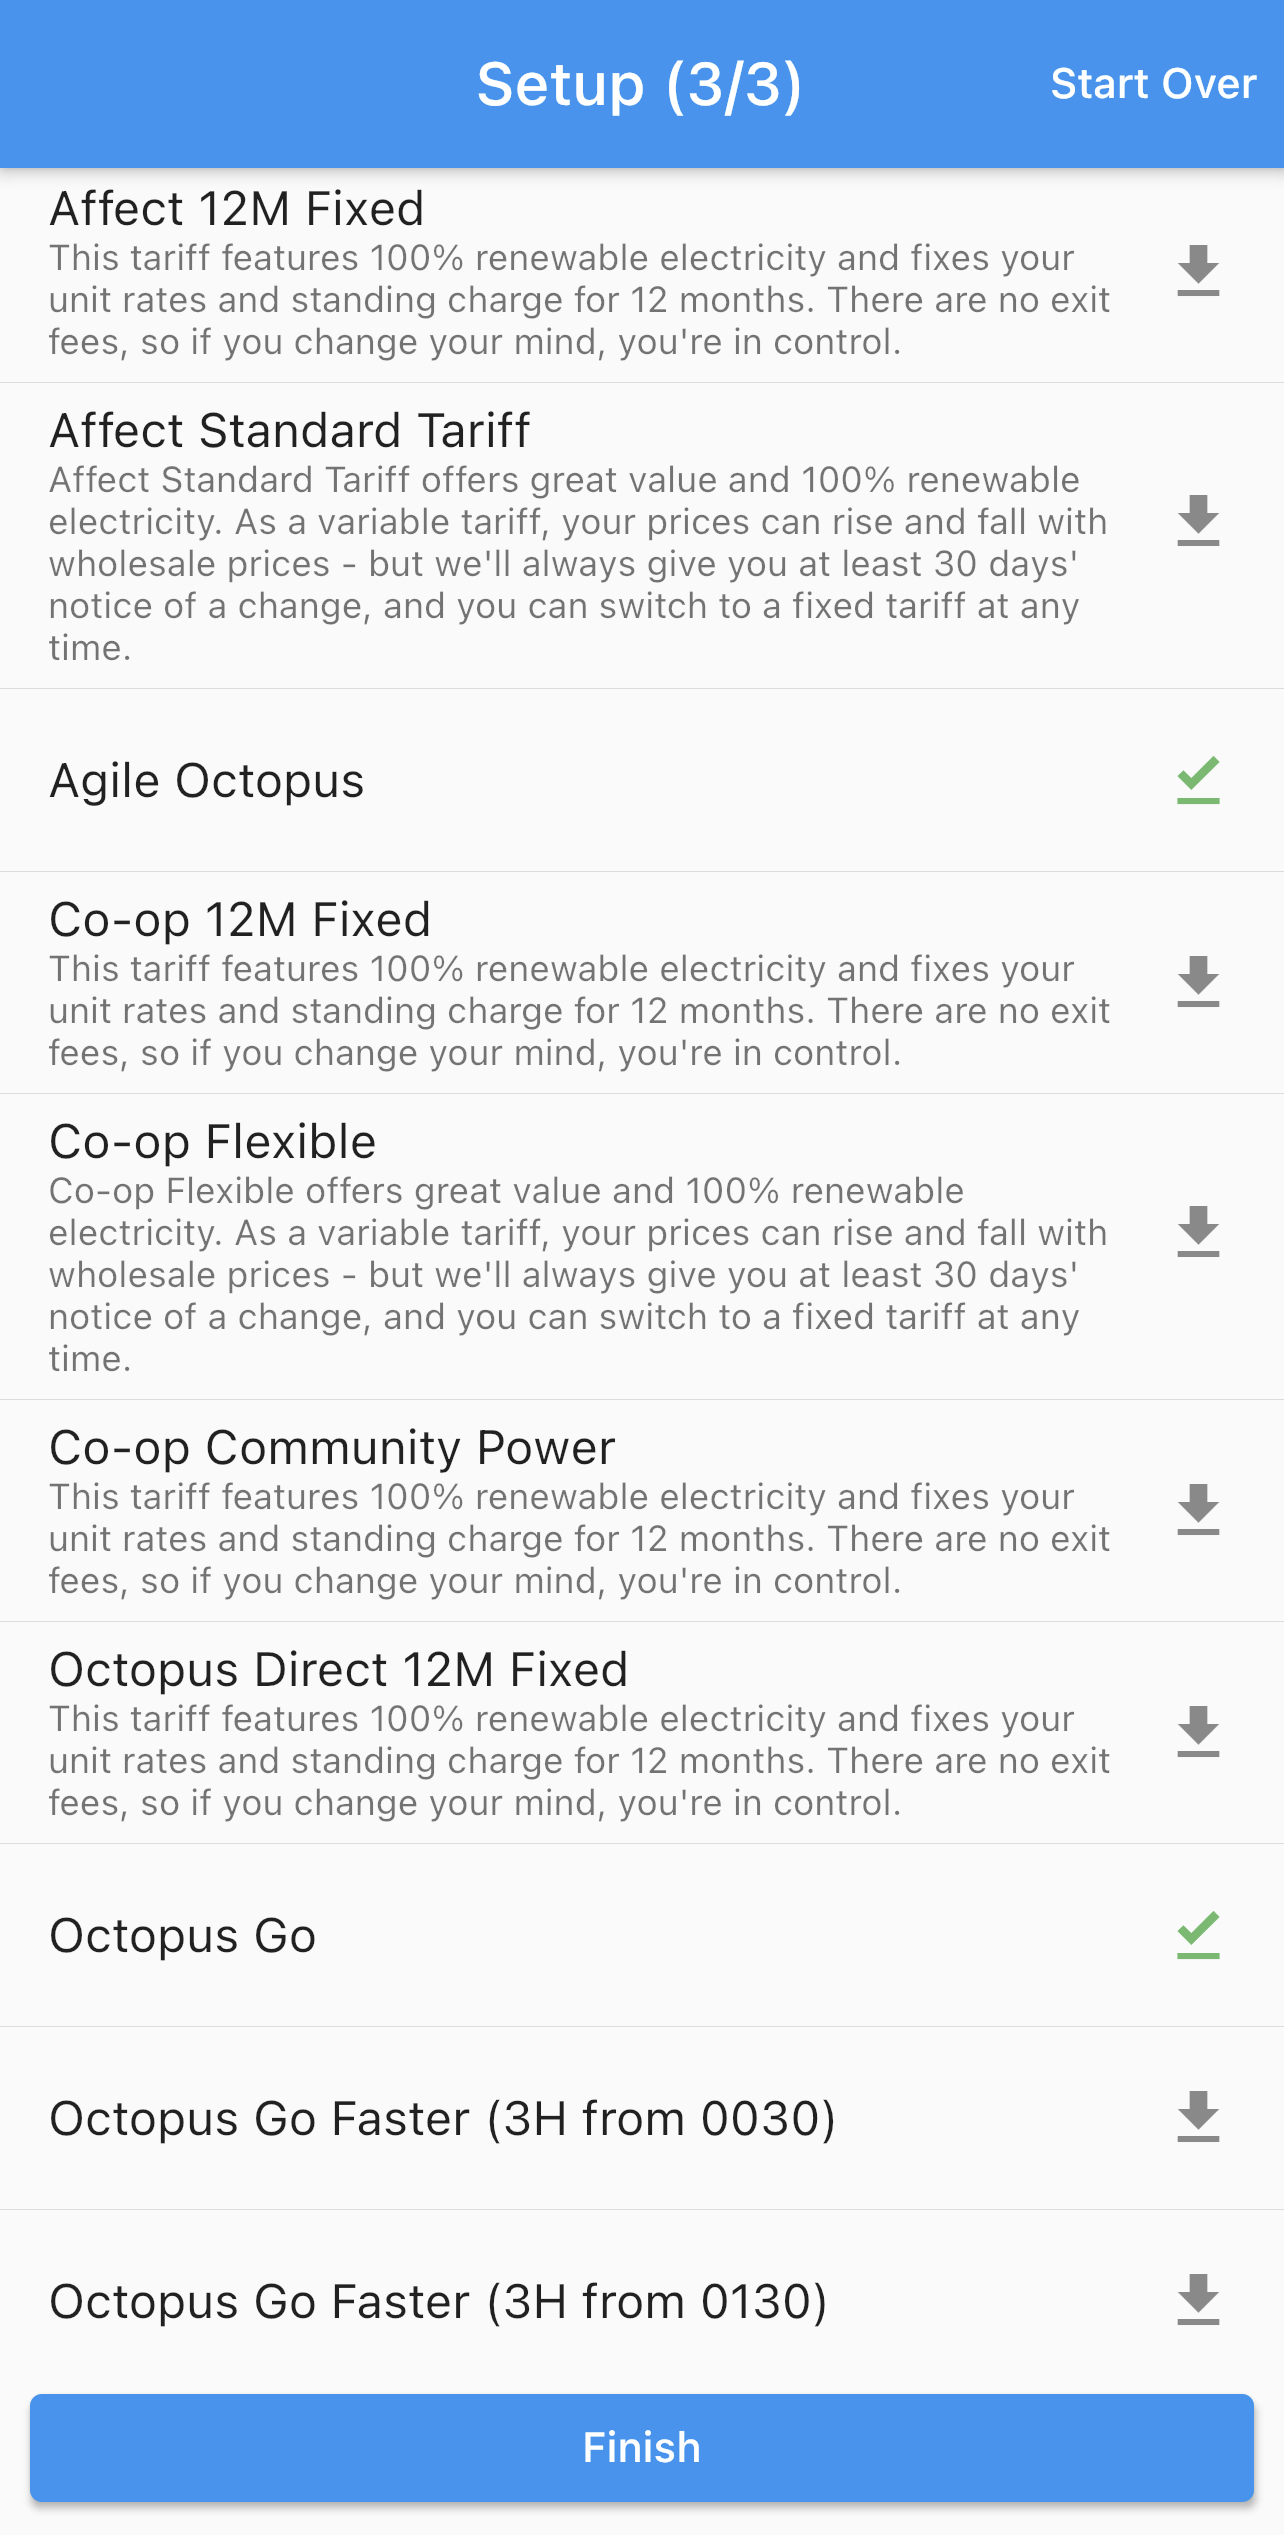 |
Once you've pressed finish, you have completed the setup and can now start using Octopus Compare.
Comparing Data
Understanding The Figures
Graph
- Half hourly consumption (Green)
- Current half hour price for both products (Blue and Red)
The graph is a great way to visualise whether you're currently shifting your consumption where possible with the cheapest areas of the selected products. Some products, such as the Go family have a set cheaper period overnight, which is perfect for charging an EV or running appliances. You can view detailed graphs for any individual day by either visiting the 'Yesterday' tab, pressing on any table row or chart column in the 'Week' or 'Month' tab or if you have an active Pro subscription, you can select it via the range selector.
The weekly and monthly graph show an overall view for each day in the range, which is each day's total consumption and price for both products. This allows you to see trends in your data to see whether you have consistent consumption and if one product is consistently cheaper with your current usage.
Remember: All data in Octopus Compare works based on actual consumption usage. One product may consistently appear cheaper due to your consumption not being shifted into its cheapest period. Smart Consumption Shifting is a Pro feature and will modify how the graphs appear.
Tables
- Time/Date
- Kilowatt Hours (kWh)
- Product Costs
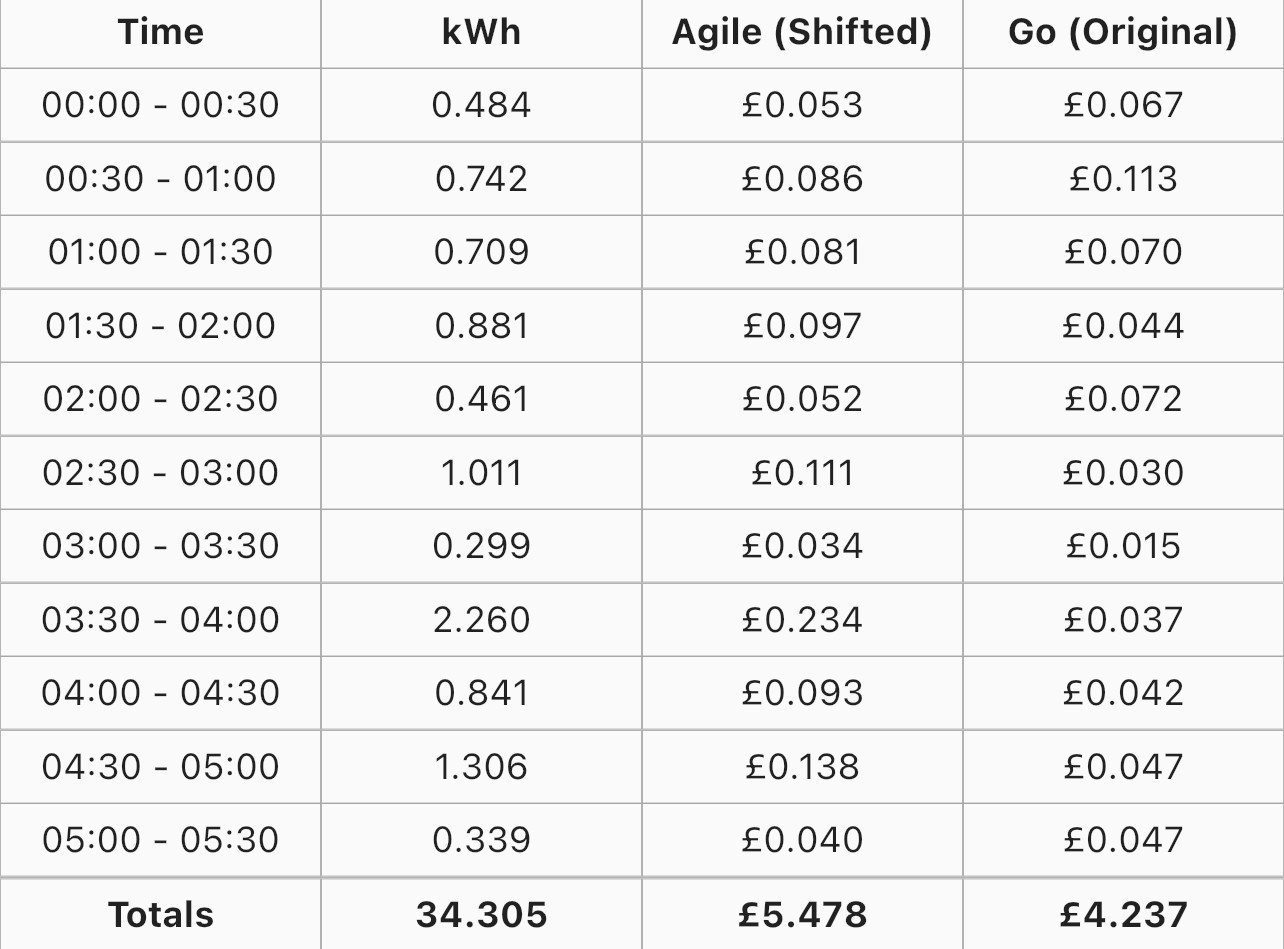
The tables on each page allow for a more in depth view of the exact figures of each product.
On views where you're viewing a single day you will see the half hourly figures for consumption and the prices for each product. These product prices are not the same as in the graph but rather a calculation between your consumption and the price of the product at this time. The totals displayed at the bottom of the graph are inclusive of the standing charge for the selected products and gives you the final cost for the day.
Views which display a collection of days will display the raw figures as shown in the graph and each product total is inclusive of the standing charge. Pressing one of these rows will open the specified day as a more detailed view.
You can configure whether you see calculations in 2 decimal places or 3 decimal places within Settings.
Overviews
- Baseload
- Average Consumption (Week, Month, Year)
- Average Unit Cost
- Standing Charge
- Best Product
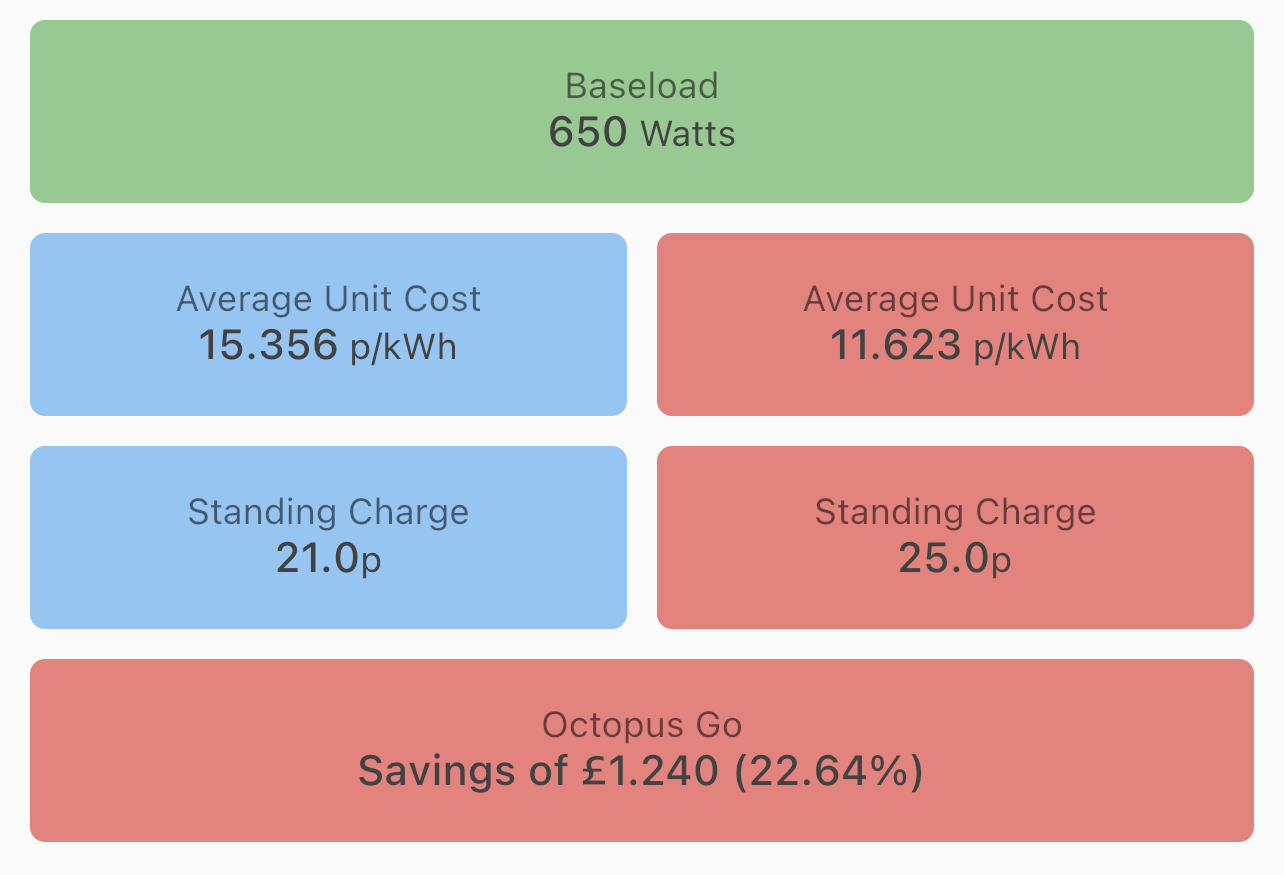
By swiping left on the table on each comparison page you will be presented with an overview for the selected tab. Some tabs may include more overview boxes than others.
Baseload is a calculation which takes into account the cheapest 2 hours of each day as the lowest possible number of watts that your household runs on. Although every attempt is made to ensure that your baseload is calculated correctly, some days may vary as usage changes throughout the year. Baseload is provided within Octopus Compare to give you an understanding of the minimum required power for your household and is also used within Smart Comparison Shifting with a Pro subscription.
Average Unit Cost is a calculation where your total cost for a product is divided by your consumption. This provides you with the average p/kWh that you spent. This can appear higher than expected occasionally dependant on usage (a low consumption will likely result in a higher average) but also is altered by including standing charge in the calculation. You can configure this in Settings to enable/disable Standing charge from the calculation to provide a more 'fair' comparison against 2 products with different Standing charges.
Missing Data
Not every system is perfect and occasionally consumption data can take some time to be retrieved and processed before being available on the Octopus Energy API. This can leave you without data for multiple days. Some data can also be retrieved incomplete, in which Octopus Compare will only download it once it no longer is missing consumption values.
Octopus Compare always tries to fetch where it left off last when fetching new data, so if you don't have data for a couple days, no problem - Octopus Compare will just continue to fetch data as usual. Similar happens for those dates that are missing between 2 dates, Octopus Compare will go back to those dates and attempt to fetch that data for you. You will see a confirmation of the dates the application tries to fetch on a refresh.
Octopus Compare tries to keep all data from Octopus Energy up-to-date. In the event that you don't receive data for an extended period of time, it is recommended that you first check whether the data is available via your Octopus Energy Dashboard and try 'Refresh All Data' in Settings --> Advanced within the app. This will refresh all your consumption data whilst persisting all your settings.
If you're missing data on your Octopus Energy Dashboard for an extended period of time, it is recommended that you first get in contact with Octopus Energy.
In the event that you're still missing data in your Octopus Compare app, please get in contact with us using our contact form.
Changing Comparison Products
Octopus Compare allows you to download as many products as you would like. Each of these products will be automatically kept up-to-date each time you refresh or open the app.
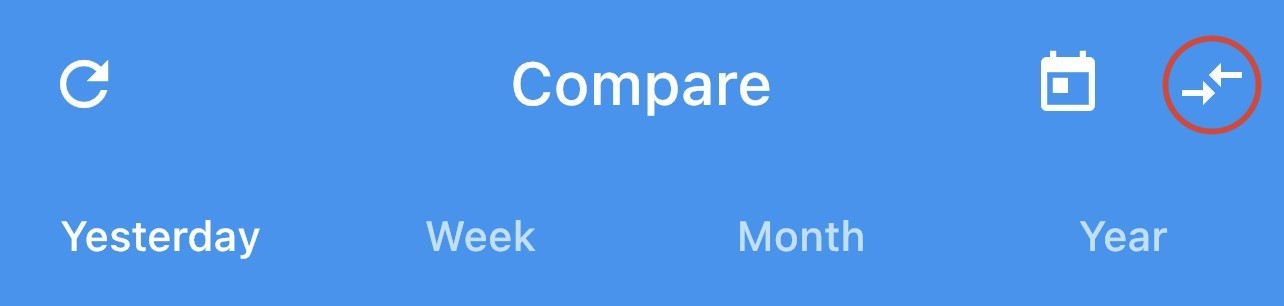
Your previously selected products will be selected by default and this can be changed at any time using the 'Compare Arrows' in the top right corner of the Compare tab.
This will open a dialog which will allow you to select the products you want to compare.
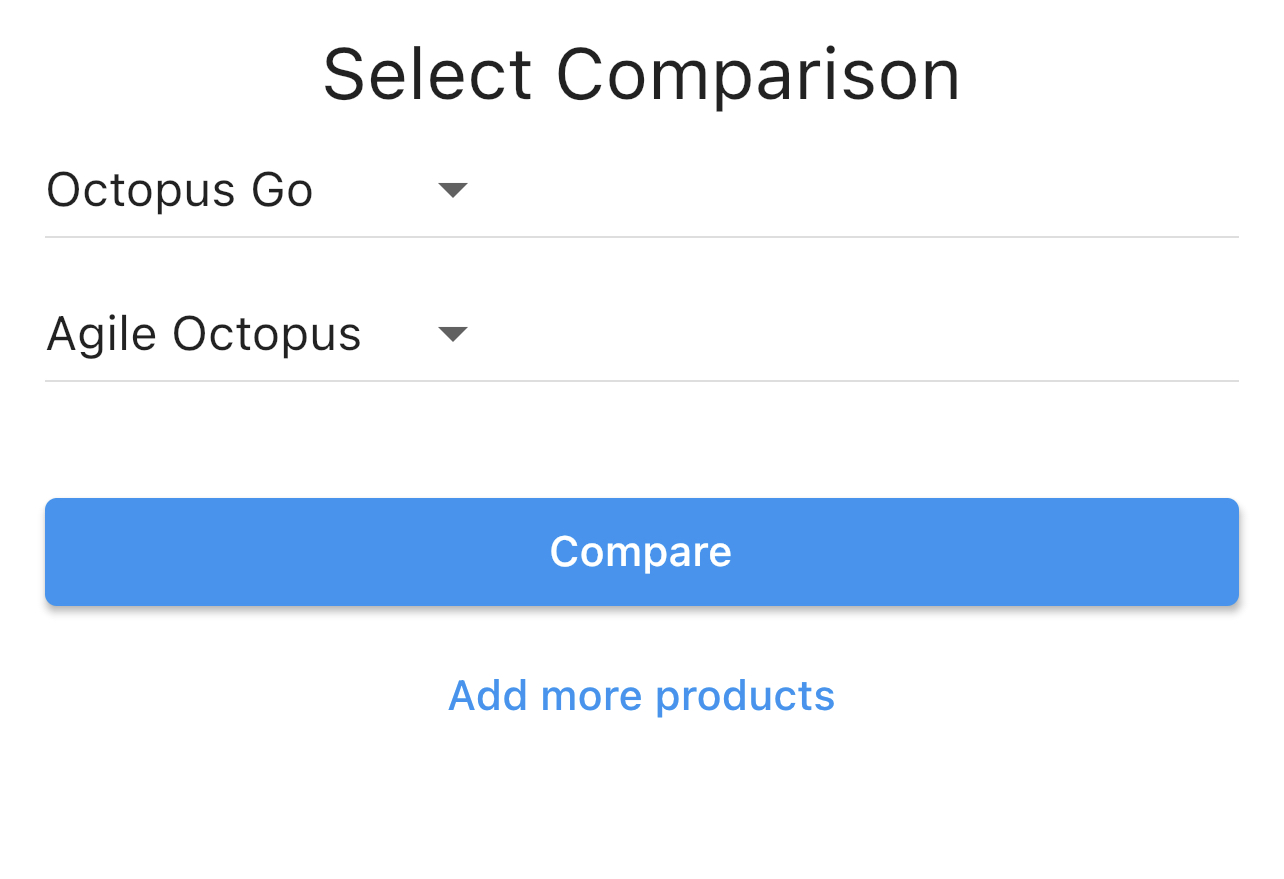
Once you have finished selecting your products, simply press 'Compare' which will close the dialog and begin displaying your new comparison.
(Pro) Comparing Custom Dates And Ranges
As a Pro subscriber, you gain access to view your yearly comparison, but also gain access to view specific days to compare, from a single date to a range.
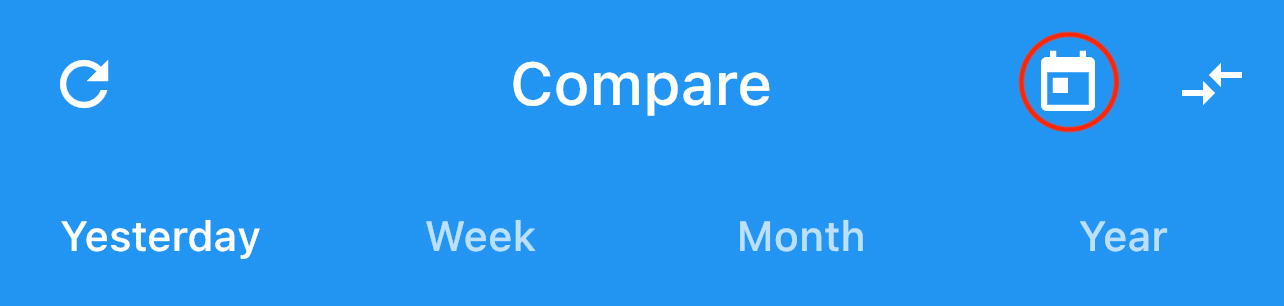
Simply select the calendar icon presented in the upper right of the Compare screen to open up a calendar.
Here you can select either a single day, or a range of days. The picker works based on 2 separate selections, one for the start date and one for the end date. To select a single day, simply select the same date twice.
 |
 |
Once done, select 'Apply' which will open up a familiar comparison page with the ability to view both the raw data and overview boxes.
(Pro) Creating Custom Tariffs
By default, some tariffs are not available within the main product list due to not appearing on the Octopus Energy API. This isn't ideal, so we've enabled the ability for you to create and maintain a tariff so that you can compare hidden tariffs and tariffs from other providers.
Creating a tariff is easy:
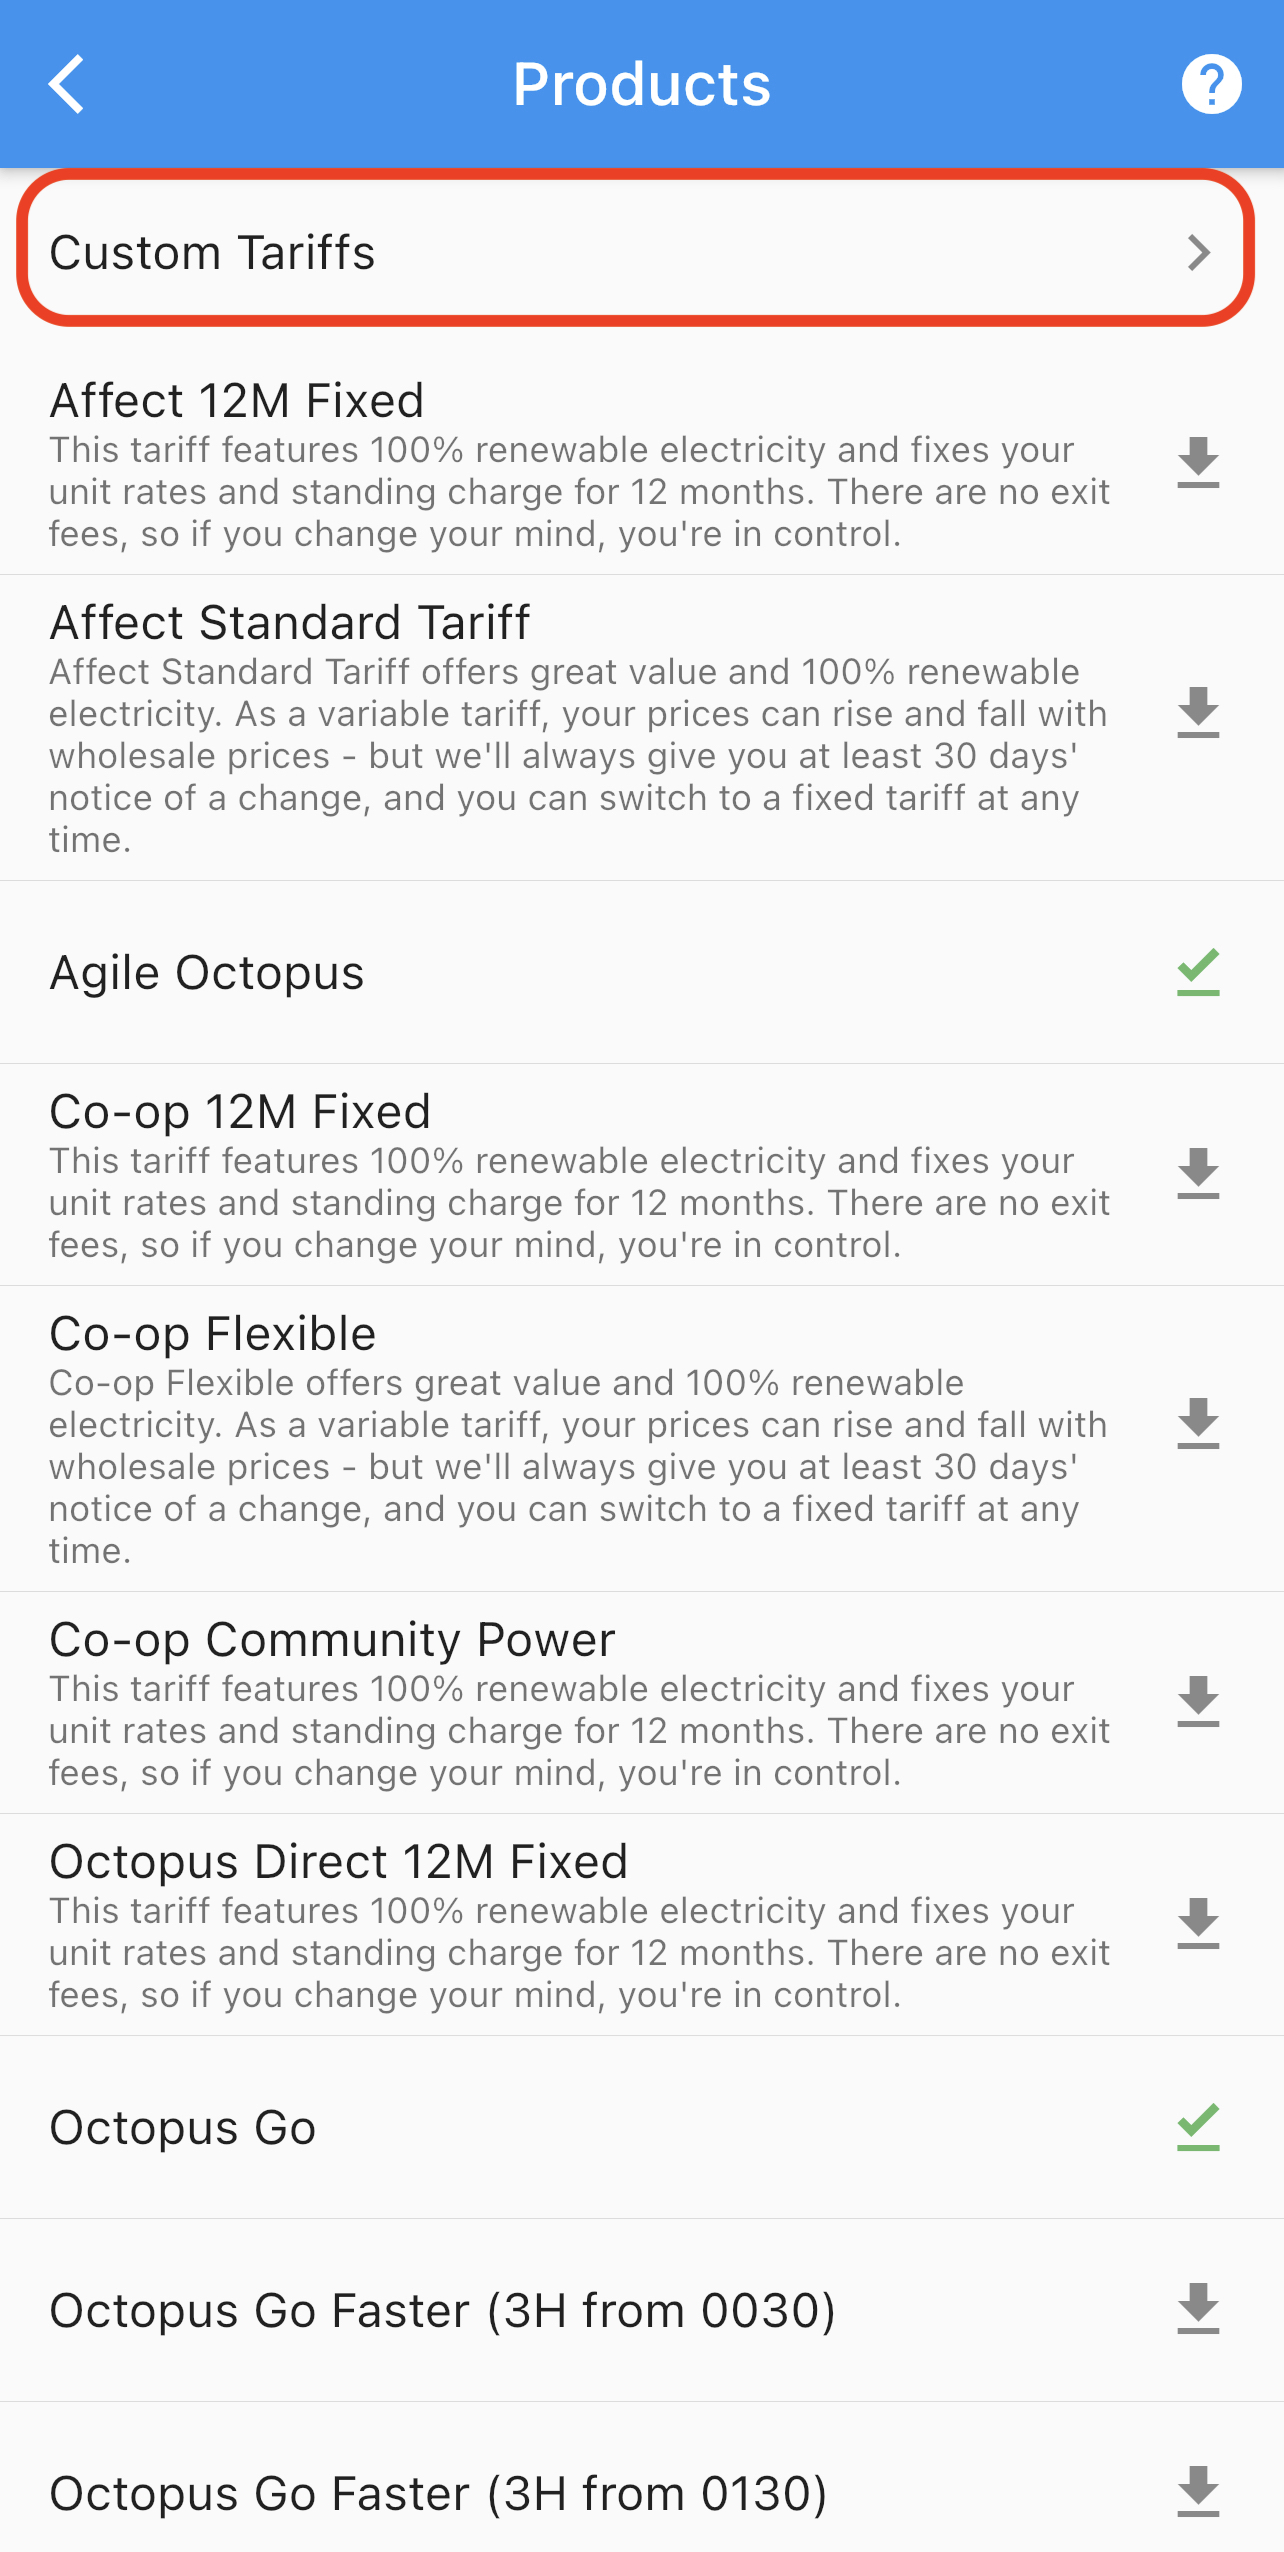
1. Head to Settings --> Products
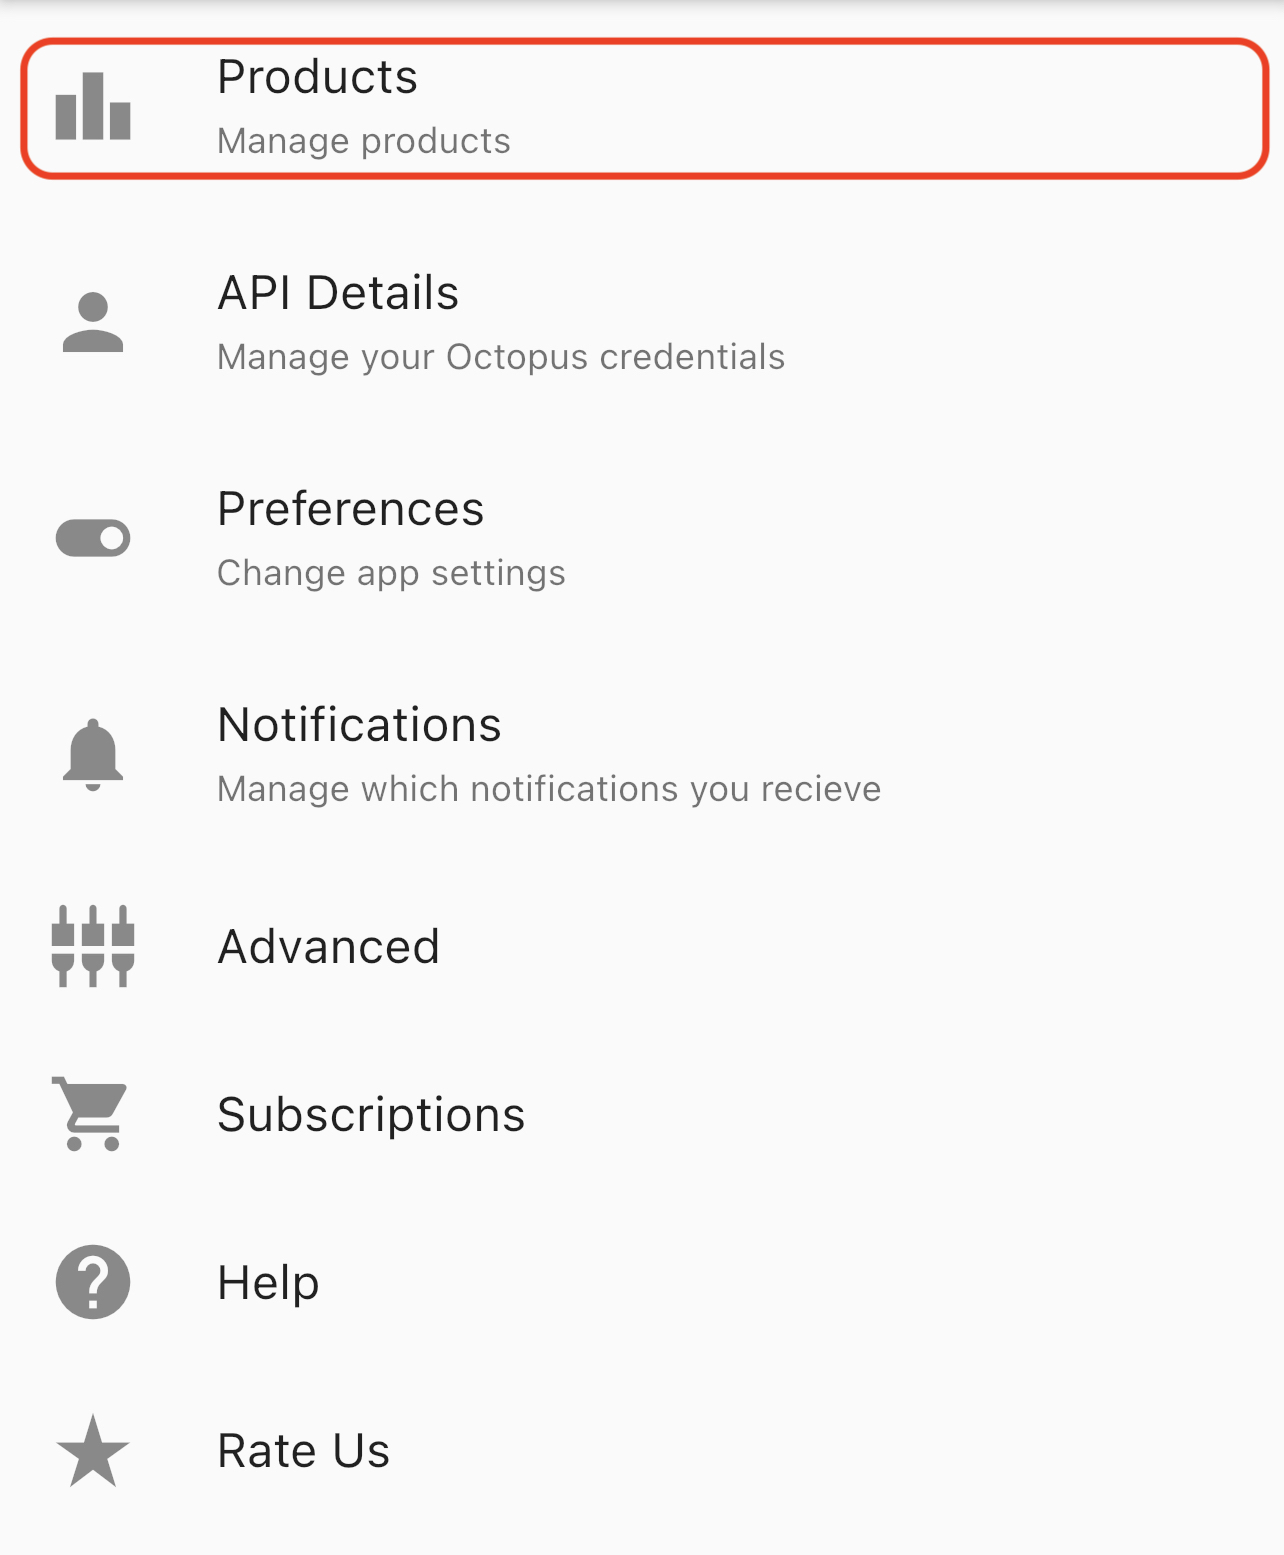
2. Click Custom Tariffs
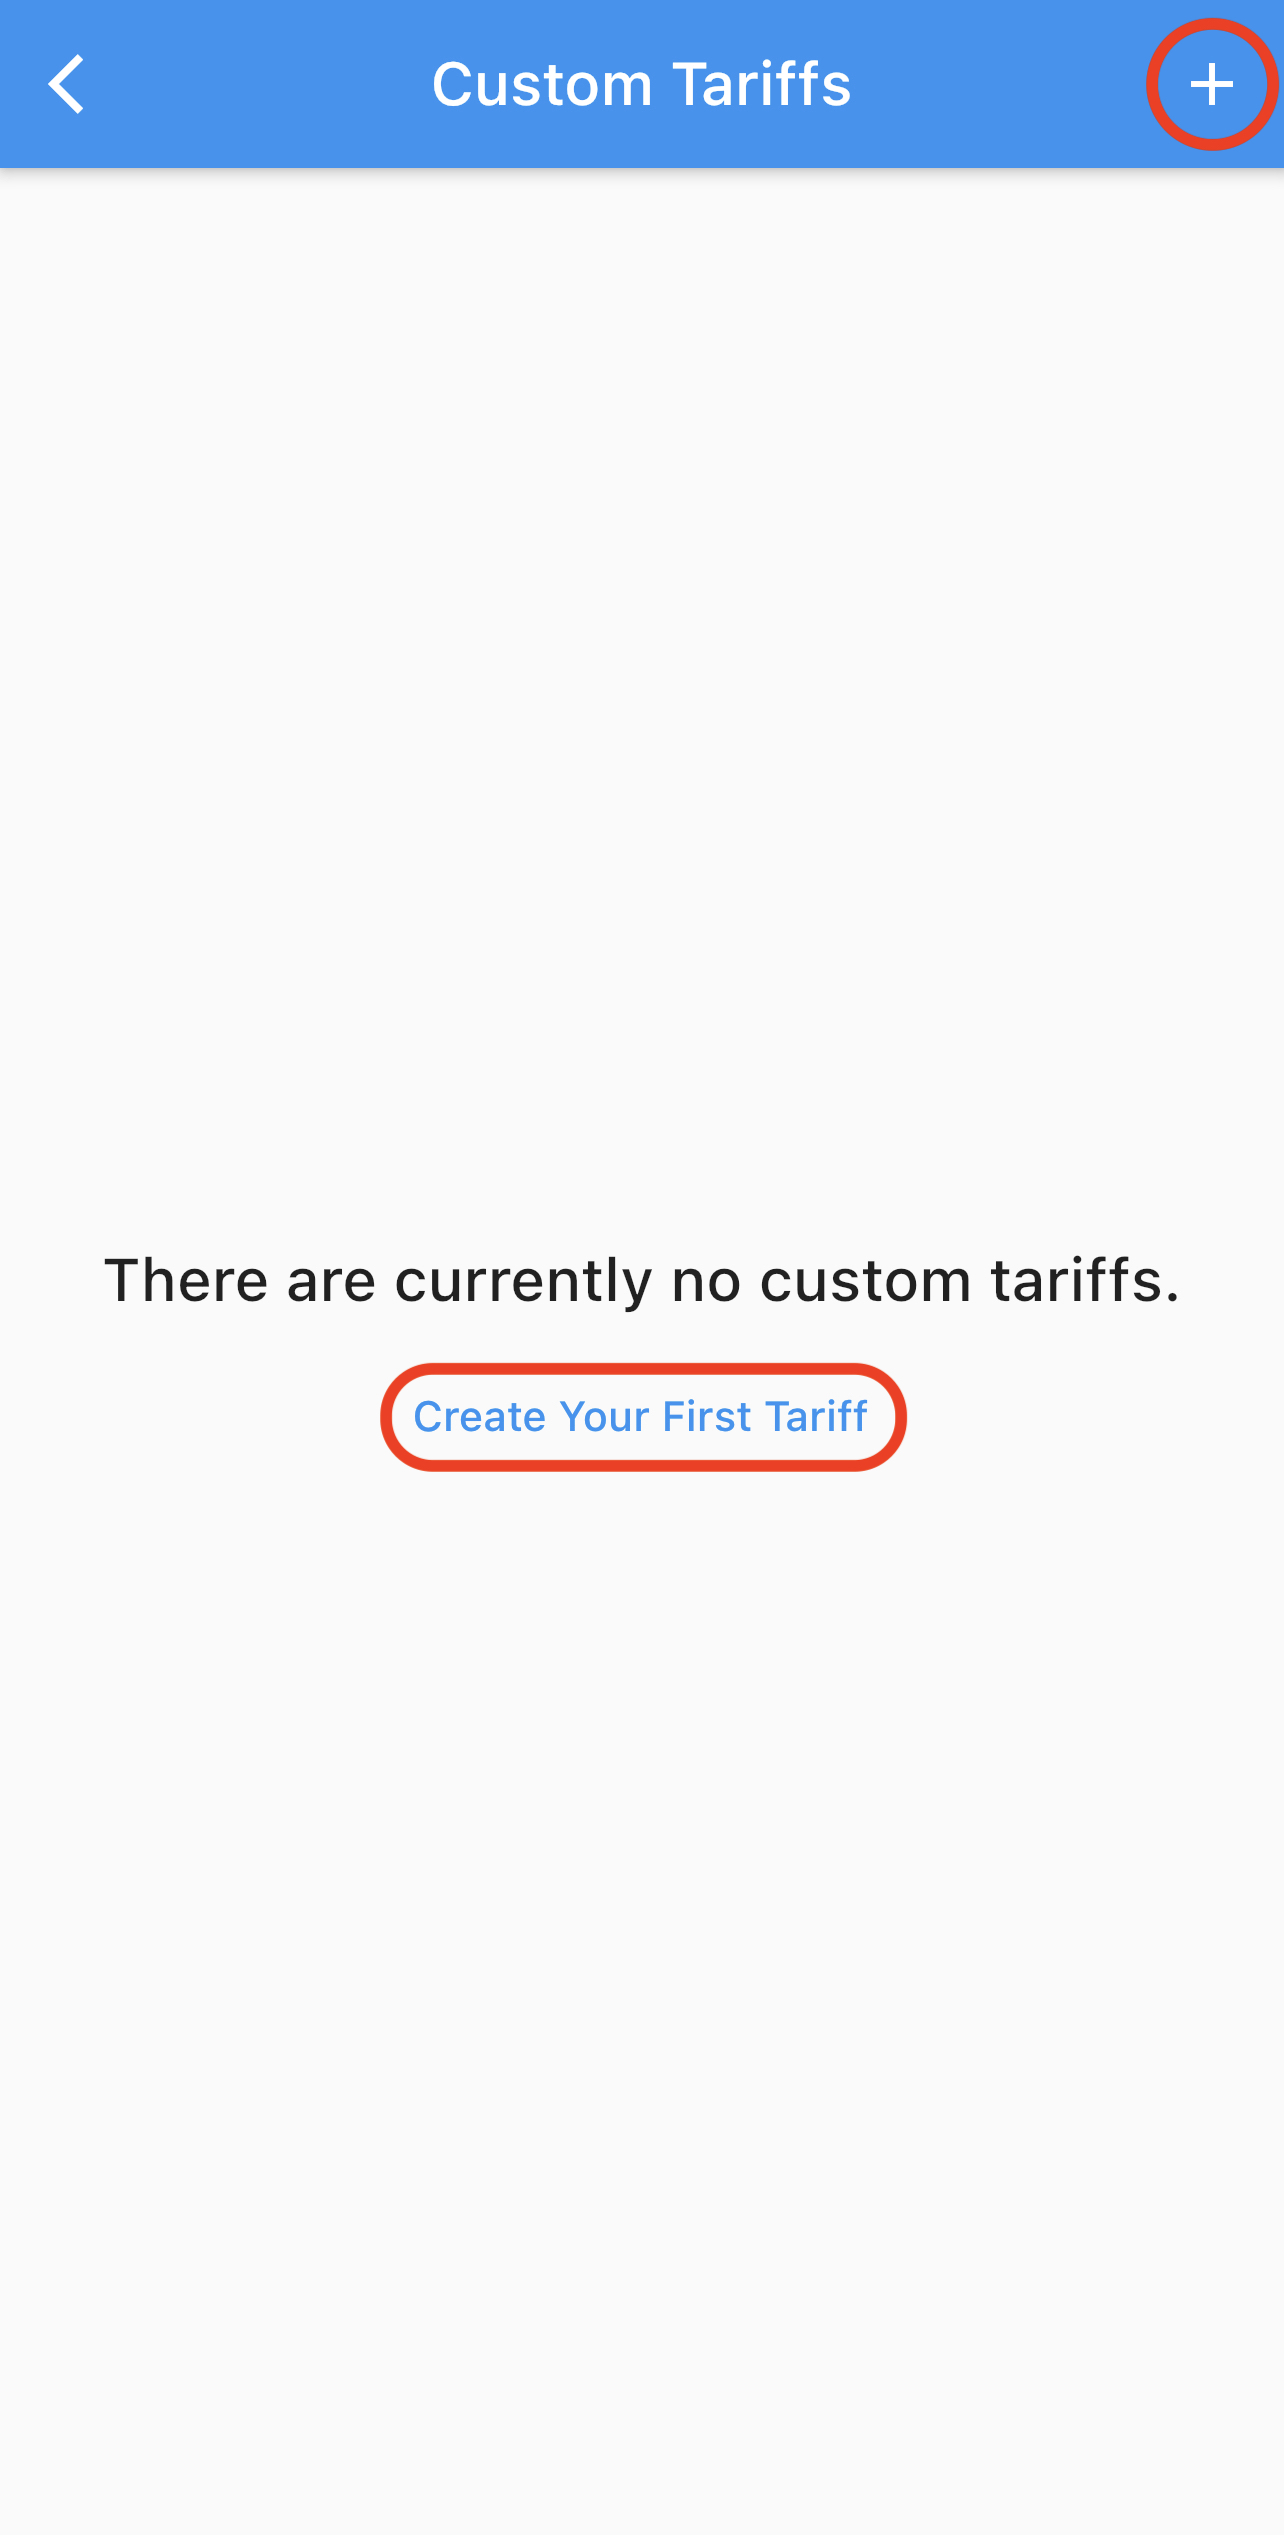
3. You will be presented with a button to Create Your First Tariff if you haven't created one before, otherwise you can use the + button in the top right
4. Once clicked, you will have access to the creation form. You will need to know the Standing Charge (in pence) and hourly unit rate (in p/kWh) for the tariff you're creating.

Tip: You can use the blue 'down fill' arrows on the right to set all fields lower than the selected arrow to the value of the field next to the selected value. This can significantly speed up your tariff creation process.
5. Finally, click Save. If you encounter an error, please first attempt to 'Refresh all data' in Settings --> Advanced. If you continue to face this issue, please get in contact with us using our contact form.
Once completed, you can return to the Compare page and select your custom tariff as you would with any other product - see 'Changing Comparison Products' for more information.
Editing/Deleting Your Tariff
If you need to edit your tariff, you can simply select the tariff again in the Custom Tariff list and you will be presented with the same form as before with all the current values for your tariff. Edit the values you would like to change and click Save.
To delete a tariff, you can swipe left on the tariff you would like to remove, and select Delete.

(Pro) Consumption Shifting
We are really excited for what this feature will bring, but please know that the feature is still actively being improved and figures shown are for illustration purposes.
Consumption shifting is a great and more fair way to compare tariffs as you are likely to shift your consumption depending on the your currently active tariff. For example, if you are an Octopus Go or Go Faster customer, you are likely to shift all your usage - especially EV charging - into the cheaper periods overnight so you avoid paying 15 p/kWh during the day.
Compare this to if you were on Octopus Agile, you could have a cheaper morning, or even plunge pricing part way through a day and you would aim to increase your consumption during this time.
What's the solution? There's not one perfect solution, as everyone's usage varies and some high peaks of usage are sometimes unavoidable, but we can get a pretty fair estimate by shifting your consumption as a perfect case. Octopus Compare does this automatically for you once switched into Consumption Shifting mode - using different figures calculated based on your consumption and tweaked using the settings provided to you, we'll automatically move your consumption to give you a more fair price for any selected tariff.
Toggling Consumption Shifting
You can toggle Consumption Shifting on or off at any time when you go to select the products you would like to compare (see Changing Comparison Products)

Once turned on, you can select your product you would like to shift and one you would like to compare it to. Currently only the first product is shifted and the second product is there for reference. We recommend setting the first product to be a product you're not currently on and the second to be the tariff you are currently on. You have the option to select the same product twice if you would like to see if your usage shifted and unshifted to see if you're currently shifting your usage in the most cost efficient way.
Once you're ready, simply select 'Shift Consumption'. This will compute your shifted price and set the app to use Consumption Shifting by default. You can view previous days, create ranges and anything else you would usually compare.
What Is The Graph Showing
Similar to the Compare graph, the Consumption Shifting graph shows your consumption and the tariff price but goes further to overlay other important metrics such as your minimum baseload threshold (the smallest consumption figure that can be shifted) and the original consumption before being shifted. This allows you to more easily visualise what has been shifted and where to.
If you would like to see the raw figures you can still achieve this by viewing the table - the consumption shown is post-shifted.
Configuring Consumption Shifting
We built Consumption Shifting so that you can configure it to suit your usage and make the results more useful.
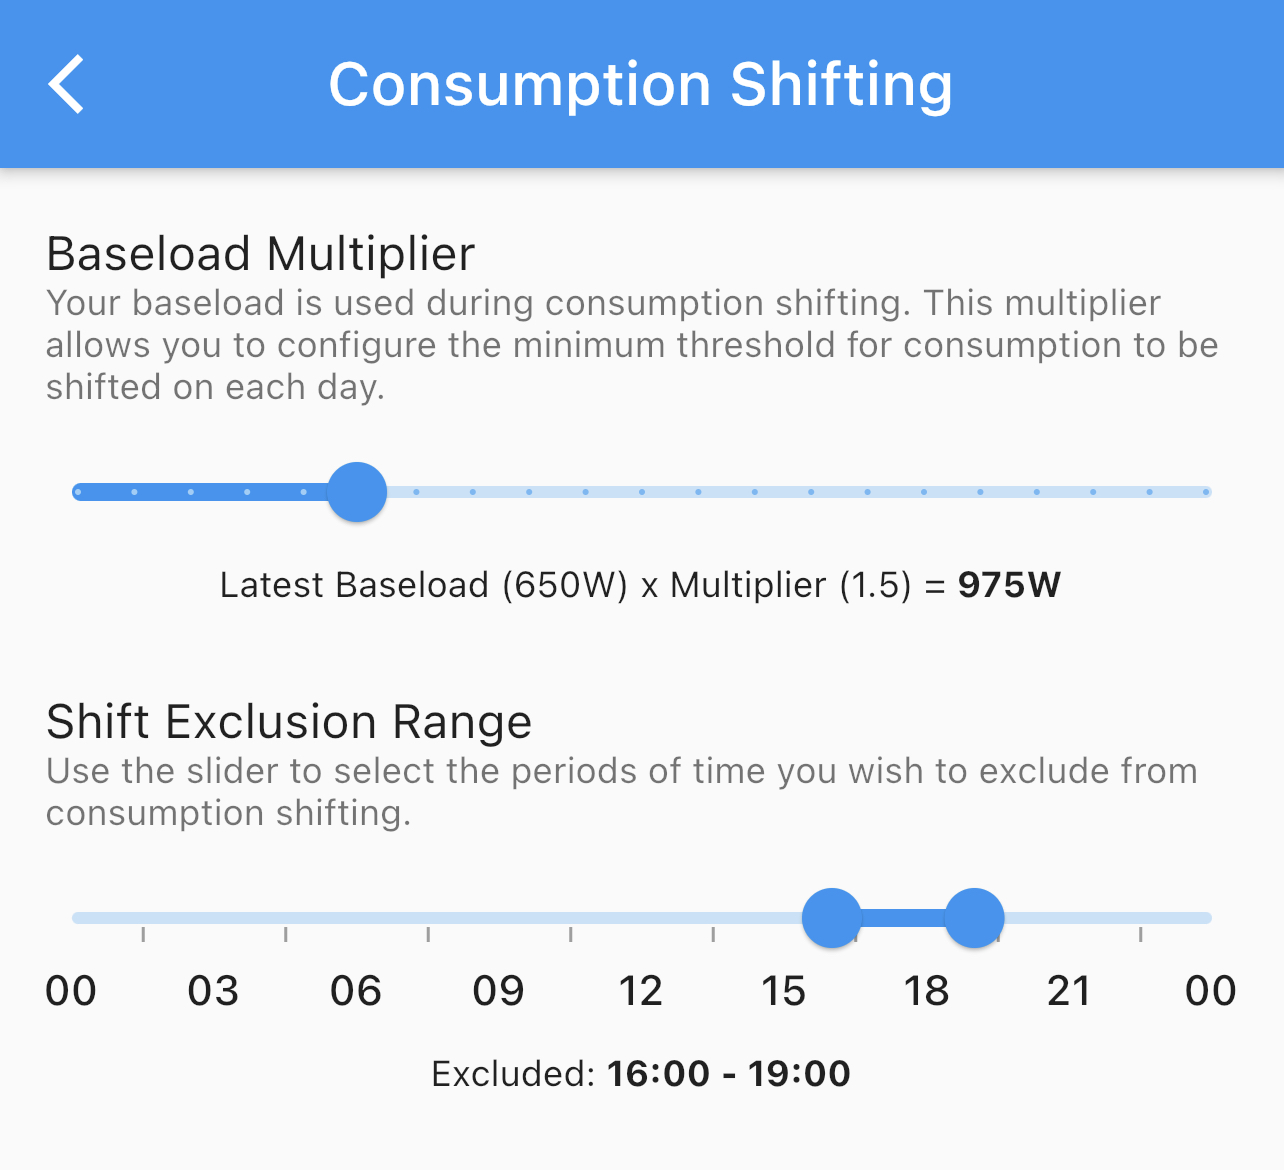
Baseload Multiplier
We use your baseload to calculate which consumption points can be shifted at any one time. This means that your general usage of electrical items such as lights or other appliances that cannot be avoided are not shifted. We found from testing, multiplying this number by 1.5 creates a good balance to ensure large peaks are moved.
You may want the shifting to be more or less sensitive based on your needs and therefore you can change this value using the slider. We have included a dynamic example below the slider to show what the minimum shifted value would be based on your usage the day before, but the final figure will be slightly different for each day.
Defaults to 1.5
We recommend you try different figures to find the best balance. Setting this multiplier to 1 can be beneficial if you don't often have large peaks of usage.
Shift Exclusion Range
Some usage typically shouldn't be shifted, especially around times where you cannot avoid using electric. This will be different for everyone and therefore we allow you to configure this dependant on your needs. You may prepare and cook between the peak times of 16:00 - 19:00 using an electric cooker and it's unlikely that you can shift this, therefore you should exclude this time so that Octopus Compare doesn't move your consumption.
Defaults to 16:00 - 19:00 as this is peak time and often usage between this time is unavoidable
Roadmap
As mentioned above, Consumption Shifting is a Beta feature and is subject to change between versions. We will be listening heavily to feedback to help improve the accuracy, reliability and efficiency of this feature.
Agile Rates
Rates And Cheapest Periods
With Octopus Agile having a different price every 30 minutes, it's important to keep up with the current and upcoming rates.
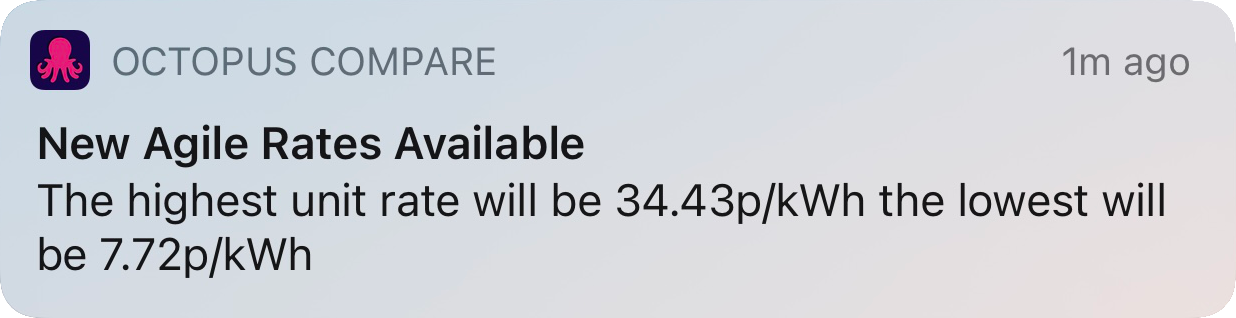
Octopus Energy typically publish the Agile rates at 4pm each day and we poll the figures to provide them to your Octopus Compare app as soon as they're available. Sometimes there can be a delay in Agile rates without warning but usually you can expect them to be available by 4:30pm each day. You can also opt into receiving notifications which will outline the cheapest and most expensive price throughout the next 24 hours and is sent as soon as the rates are available.
Upcoming Rates Table
Octopus Compare allows for you to view any past and future rates by scrolling through the provided table. Each row will contain both the time the rate is valid between, a colour indicator and the price. Below outlines the the thresholds for each colour displayed in the table.
| 0 p/kWh and below | Blue |
| 1 p/kWh to 10 p/kWh | Green |
| 10 p/kWh to 25 p/kWh | Orange |
| 25 p/kWh and above | Red |
Each colour is divided into a lighter and darker variant dependants on the price between the range.
Rate Alarms (Pro)
As a Pro subscriber you can set an alarm for a specific rate by clicking on the bell icon next to the rate. You can set if the alarm is preemptive to alert you up to 30 minutes before the selected tariff time within Settings --> Notifications. You will receive a notification outlining the price for the period selected.
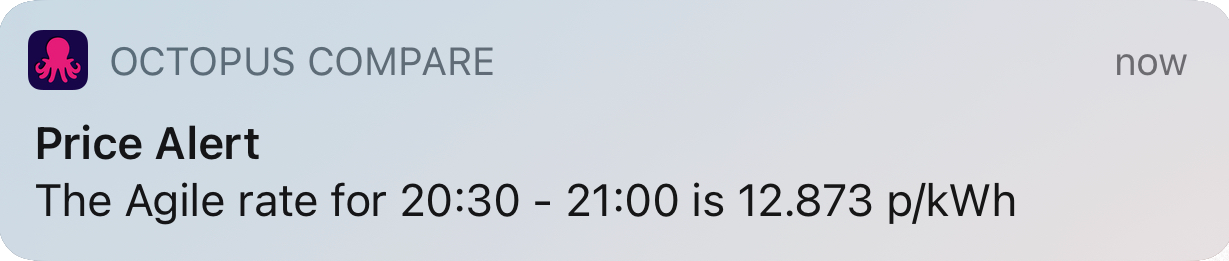
Price Drops (Pro)
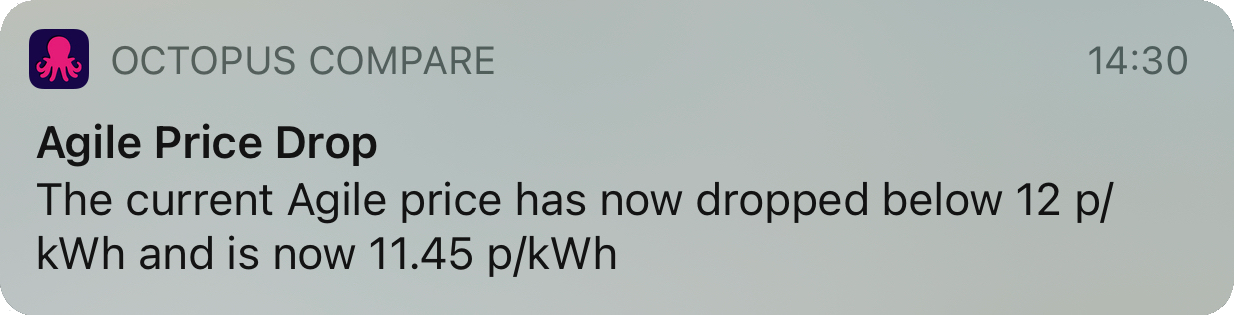
As a Pro subscriber you can set an automatic alert for when a rate drops below a set price. You are only required to set this up once and we'll handle the rest for you. To set this up, head to Settings --> Notifications and find the dropdown labelled Agile Price Trigger.
 You can set this value to any figure you would like and each time the current rate drops below your threshold, you will receive an alert. This does not guarantee that the rate will remain consistently under your trigger, but often rates will remain around your threshold for multiple half hour periods.
Cheapest Periods
Octopus Compare makes it easy to get an overview of when the next cheapest period is approaching dependant on how long you may require up to 6 hours. By swiping left on the Agile Rates table you will be presented with a 2x3 grid which outlines the current cheapest periods throughout the day.
We automatically discover which consecutive half hours have the cheapest overall average unit rates and present them as overview boxes. Therefore if you require 6 hours to charge your EV you can view the 6 hour cheapest rate box and find that you will average the displayed pence per Kilowatt Hour.
The cheapest period will always show the next cheapest and therefore may display more expensive averages throughout the day as there are less available rates.

Home Screen Widgets
Octopus Compare comes bundled with some Home Screen widgets to allow easy access to changing data such as Agile rates and the cheapest periods. There are widgets available for both iOS and Android.
iOS
All iOS widgets require iOS 14+ and include the Agile rates and Cheapest Periods. An example of both can be seen below.
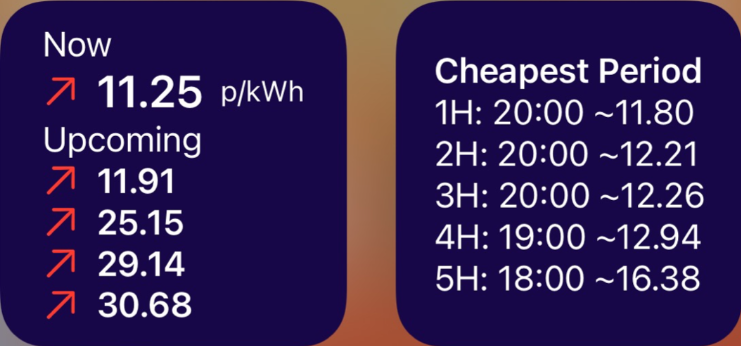
The Agile Rate widget (left) displays the current rate, along with up to the next 2 hours of available rates. Different icons can appear next to the price including:
- Red up arrow if the price is increased since the previous half hour
- Green down arrow if the price as decreased since the previous half hour
- Yellow dots if the price is the same as the previous half hour
You can customise this widget by long pressing and selecting Edit Widget which provides you with an option to toggle the time relating to the price if you wish.
The Cheapest Period widget displays the same information as within the Agile Rates tab up to the cheapest 5 hour hour period. This is not customisable at this time.
Android
Currently, as of version 1.3, Android only contains a singular Home Screen widget which displays the current and upcoming Agile Rates and can be resized to only show the current rate. Plans to bring the cheapest period widget are in the works and this article will be updated when available. The current widget and variety can be seen below:

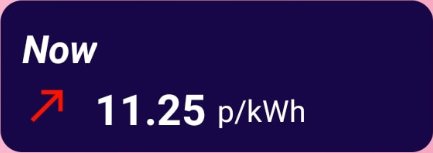
Sometimes widgets can become out of sync or fail to update with new data. If you encounter a 'No Data' message or begin losing the ability to view upcoming rates or cheapest periods, it usually can be solved by returning to the Agile Rates page within Octopus Compare and refreshing.
(Pro) Viewing Past Rates
Viewing past Agile rates works similar to creating custom ranges within the Compare tab.
As a Pro subscriber you can view up to a year worth of data for your region, which is especially useful if you're new to the tariff and would like an idea the average trend of the Agile prices at different times of the year.
To access the date picker, simply click the Calendar icon in the top right corner.

Select a date you would like to view and click Select
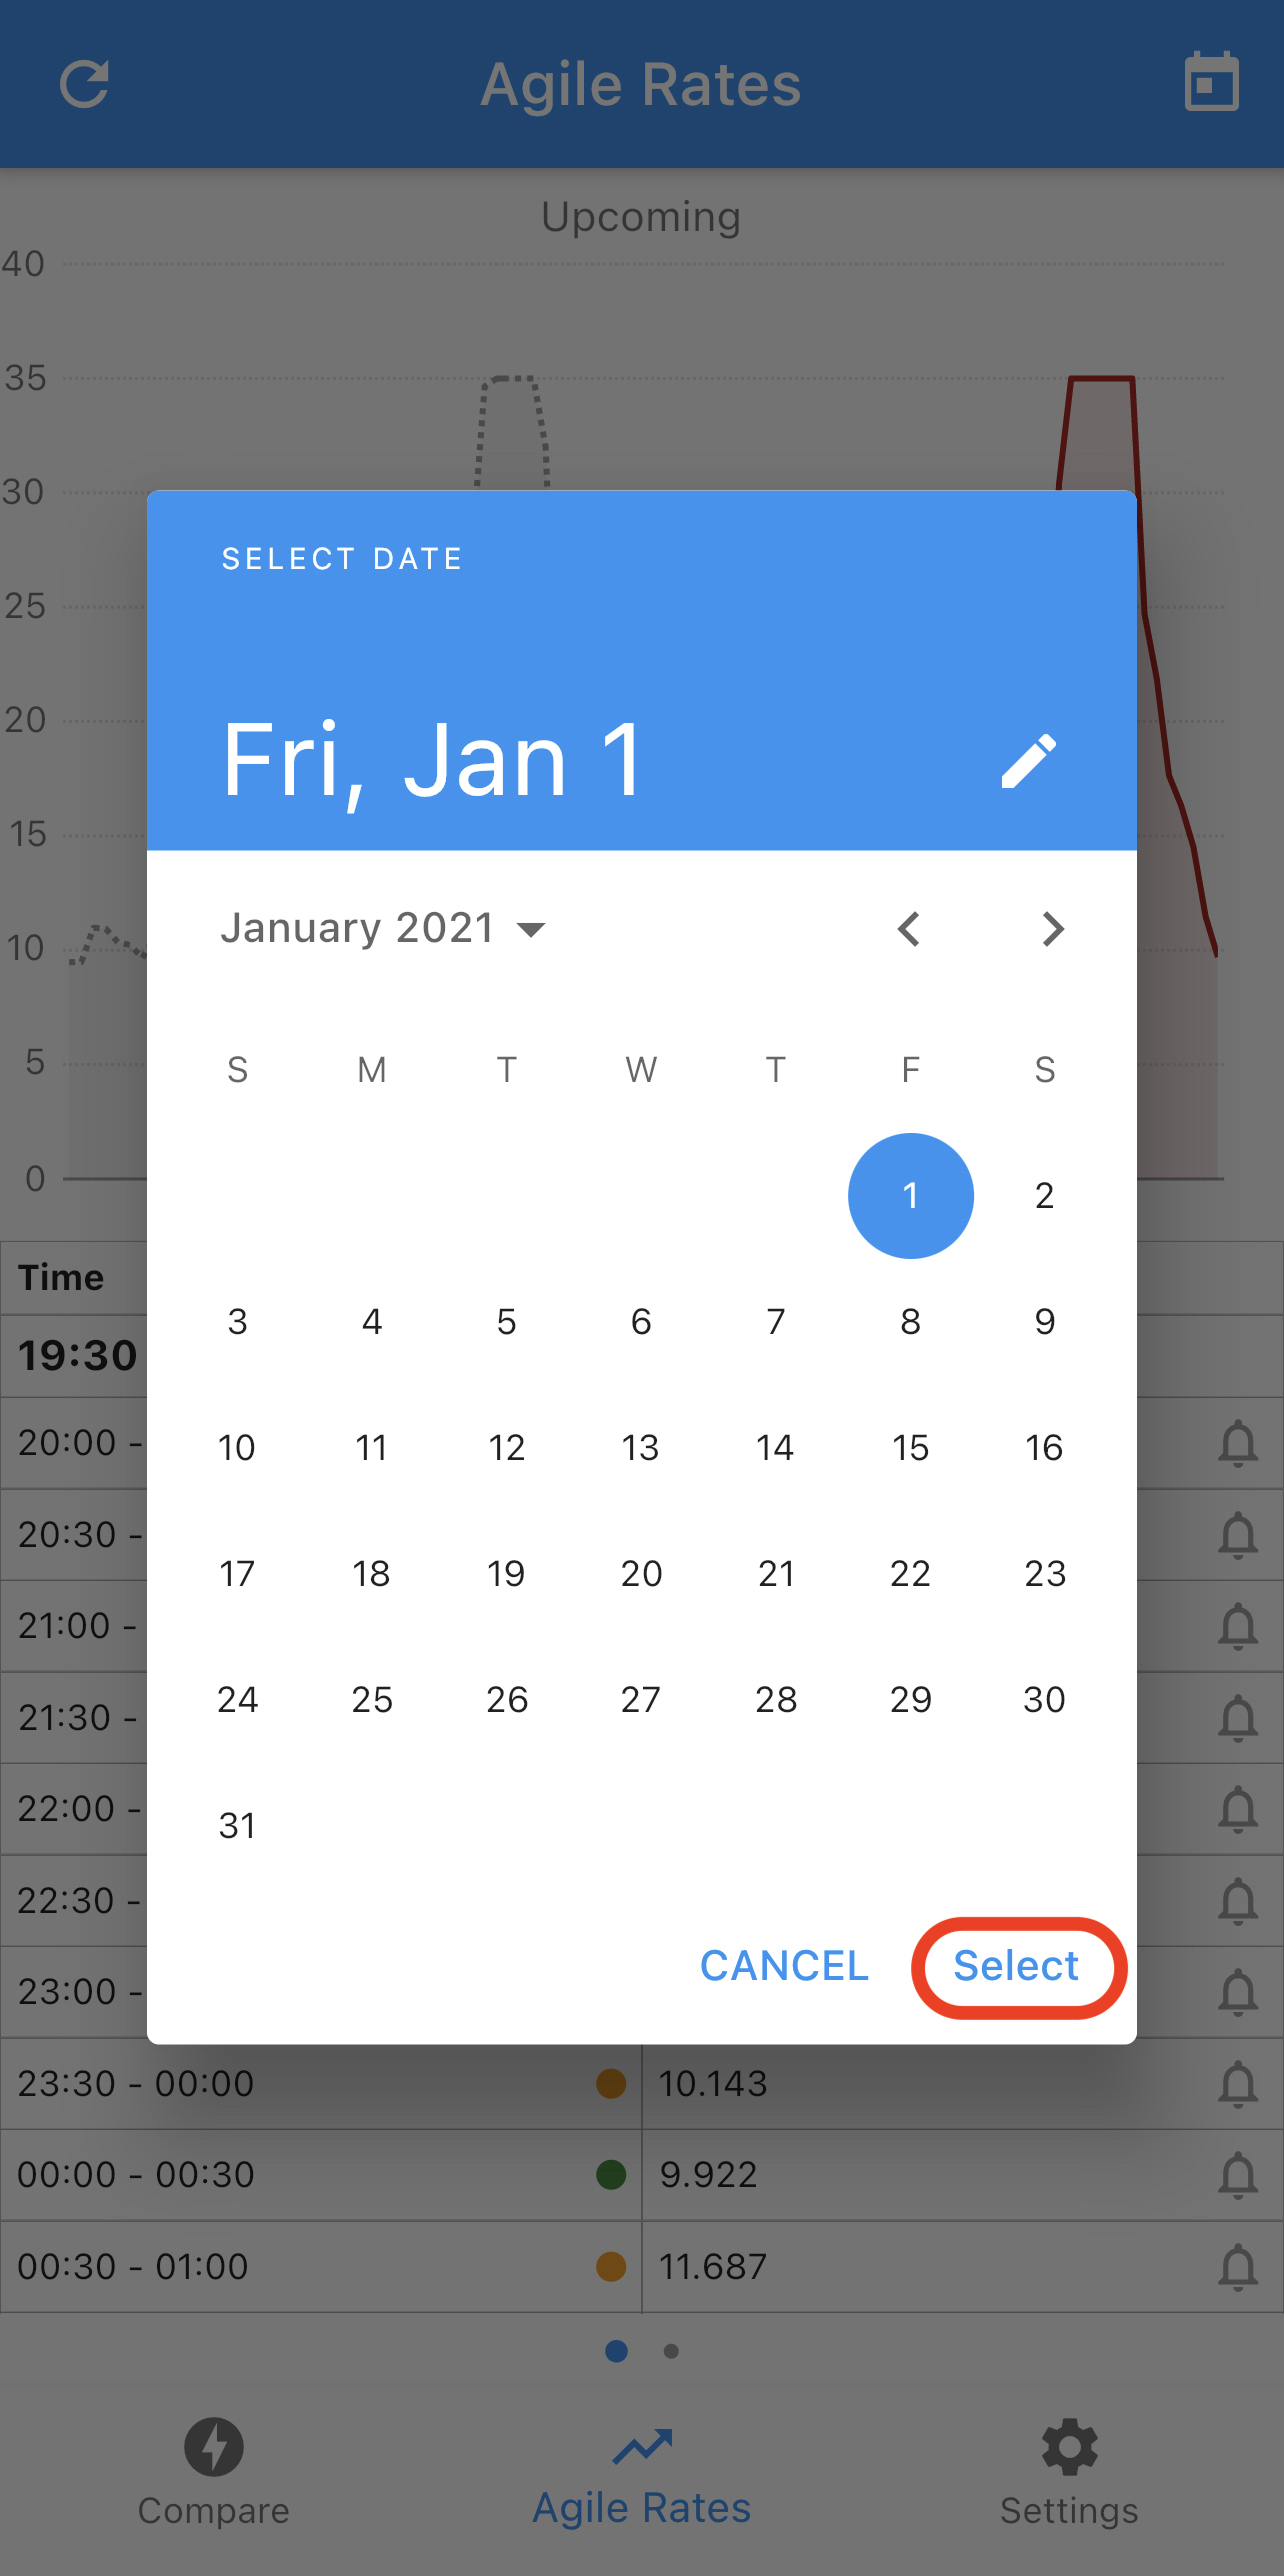
You will be presented with a sheet which has the graph for the date along with the data table similar to the current upcoming rates.
Configuring Octopus Compare
Octopus Compare has many configurable options to make your experience better and as the application grows more will be added. Below are some options which you can customise currently within the application. These settings can be found within Settings --> Customisation.
Calculation Resolution
You can change how many decimal places are shown on all figures within the application to show either 2 or 3 decimal places. Sometimes having too many decimal places can become confusing and therefore this option is set to 2 decimal places by default.
Include Standing Charge
By default we don't include standing charge when calculating averages in your comparisons. You may wish to toggle this to include the standing charge for the products if you have low consumption figures as this can help with deciding which tariff is on average cheaper for you.
Having this toggled on will likely increase the average above the expected - for example on a tariff which doesn't have rates higher than 15p may have an average higher than 15p if you include the standing charge.
Table figures always include the standing charge
Customise Month View
Not all bills start on the same date. By default Octopus Compare will show the last month worth of data if Customise Month View is not toggled on.
Toggling on this value will allow you to set when you would like your month tab to start from allowing you to see a more accurate billing month.
Default View
We have enabled the ability to set the default view which is shown underneath the graph so that you can view the information you find more useful first.
| Data View | Overview |
 |
 |