Comparing Data
- Understanding The Figures
- Missing Data
- Changing Comparison Products
- (Pro) Comparing Custom Dates And Ranges
- (Pro) Creating Custom Tariffs
- (Pro) Consumption Shifting
Understanding The Figures
Graph
- Half hourly consumption (Green)
- Current half hour price for both products (Blue and Red)
The graph is a great way to visualise whether you're currently shifting your consumption where possible with the cheapest areas of the selected products. Some products, such as the Go family have a set cheaper period overnight, which is perfect for charging an EV or running appliances. You can view detailed graphs for any individual day by either visiting the 'Yesterday' tab, pressing on any table row or chart column in the 'Week' or 'Month' tab or if you have an active Pro subscription, you can select it via the range selector.
The weekly and monthly graph show an overall view for each day in the range, which is each day's total consumption and price for both products. This allows you to see trends in your data to see whether you have consistent consumption and if one product is consistently cheaper with your current usage.
Remember: All data in Octopus Compare works based on actual consumption usage. One product may consistently appear cheaper due to your consumption not being shifted into its cheapest period. Smart Consumption Shifting is a Pro feature and will modify how the graphs appear.
Tables
- Time/Date
- Kilowatt Hours (kWh)
- Product Costs
The tables on each page allow for a more in depth view of the exact figures of each product.
On views where you're viewing a single day you will see the half hourly figures for consumption and the prices for each product. These product prices are not the same as in the graph but rather a calculation between your consumption and the price of the product at this time. The totals displayed at the bottom of the graph are inclusive of the standing charge for the selected products and gives you the final cost for the day.
Views which display a collection of days will display the raw figures as shown in the graph and each product total is inclusive of the standing charge. Pressing one of these rows will open the specified day as a more detailed view.
You can configure whether you see calculations in 2 decimal places or 3 decimal places within Settings.
Overviews
- Baseload
- Average Consumption (Week, Month, Year)
- Average Unit Cost
- Standing Charge
- Best Product
By swiping left on the table on each comparison page you will be presented with an overview for the selected tab. Some tabs may include more overview boxes than others.
Baseload is a calculation which takes into account the cheapest 2 hours of each day as the lowest possible number of watts that your household runs on. Although every attempt is made to ensure that your baseload is calculated correctly, some days may vary as usage changes throughout the year. Baseload is provided within Octopus Compare to give you an understanding of the minimum required power for your household and is also used within Smart Comparison Shifting with a Pro subscription.
Average Unit Cost is a calculation where your total cost for a product is divided by your consumption. This provides you with the average p/kWh that you spent. This can appear higher than expected occasionally dependant on usage (a low consumption will likely result in a higher average) but also is altered by including standing charge in the calculation. You can configure this in Settings to enable/disable Standing charge from the calculation to provide a more 'fair' comparison against 2 products with different Standing charges.
Missing Data
Not every system is perfect and occasionally consumption data can take some time to be retrieved and processed before being available on the Octopus Energy API. This can leave you without data for multiple days. Some data can also be retrieved incomplete, in which Octopus Compare will only download it once it no longer is missing consumption values.
Octopus Compare always tries to fetch where it left off last when fetching new data, so if you don't have data for a couple days, no problem - Octopus Compare will just continue to fetch data as usual. Similar happens for those dates that are missing between 2 dates, Octopus Compare will go back to those dates and attempt to fetch that data for you. You will see a confirmation of the dates the application tries to fetch on a refresh.
Octopus Compare tries to keep all data from Octopus Energy up-to-date. In the event that you don't receive data for an extended period of time, it is recommended that you first check whether the data is available via your Octopus Energy Dashboard and try 'Refresh All Data' in Settings --> Advanced within the app. This will refresh all your consumption data whilst persisting all your settings.
If you're missing data on your Octopus Energy Dashboard for an extended period of time, it is recommended that you first get in contact with Octopus Energy.
In the event that you're still missing data in your Octopus Compare app, please get in contact with us using our contact form.
Changing Comparison Products
Octopus Compare allows you to download as many products as you would like. Each of these products will be automatically kept up-to-date each time you refresh or open the app.
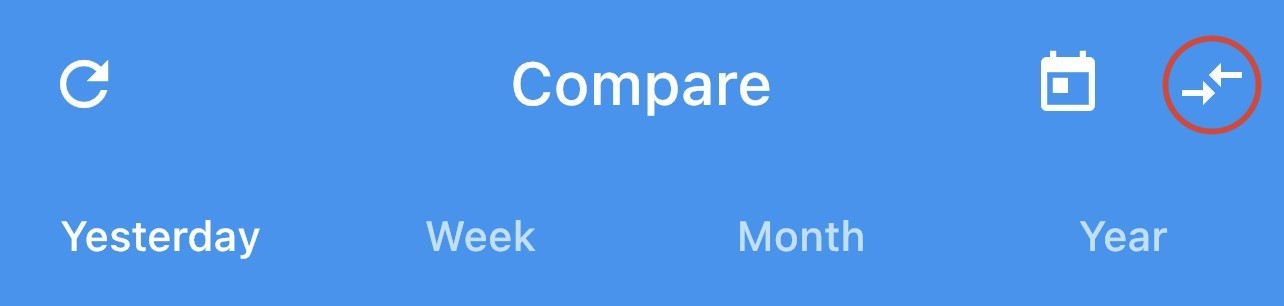
Your previously selected products will be selected by default and this can be changed at any time using the 'Compare Arrows' in the top right corner of the Compare tab.
This will open a dialog which will allow you to select the products you want to compare.
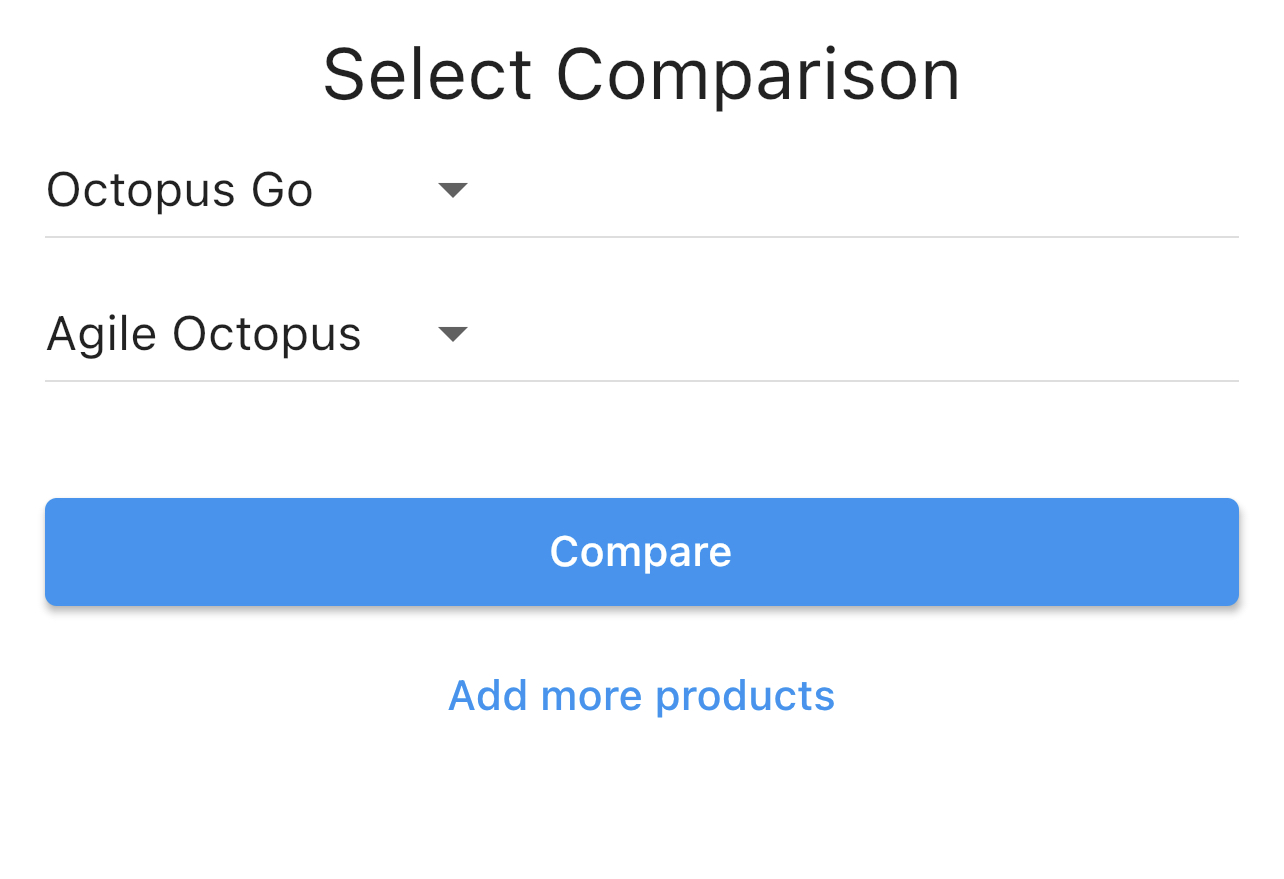
Once you have finished selecting your products, simply press 'Compare' which will close the dialog and begin displaying your new comparison.
(Pro) Comparing Custom Dates And Ranges
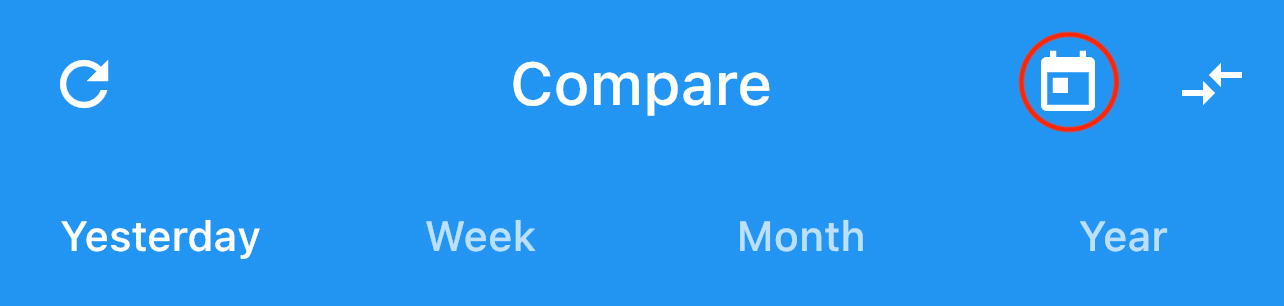
As a Pro subscriber, you gain access to view your yearly comparison, but also gain access to view specific days to compare, from a single date to a range.
Simply select the calendar icon presented in the upper right of the Compare screen to open up a calendar.
Here you can select either a single day, or a range of days. The picker works based on 2 separate selections, one for the start date and one for the end date. To select a single day, simply select the same date twice.
 |
 |
Once done, select 'Apply' which will open up a familiar comparison page with the ability to view both the raw data and overview boxes.
(Pro) Creating Custom Tariffs
By default, some tariffs are not available within the main product list due to not appearing on the Octopus Energy API. This isn't ideal, so we've enabled the ability for you to create and maintain a tariff so that you can compare hidden tariffs and tariffs from other providers.
Creating a tariff is easy:
1. Head to Settings --> Products
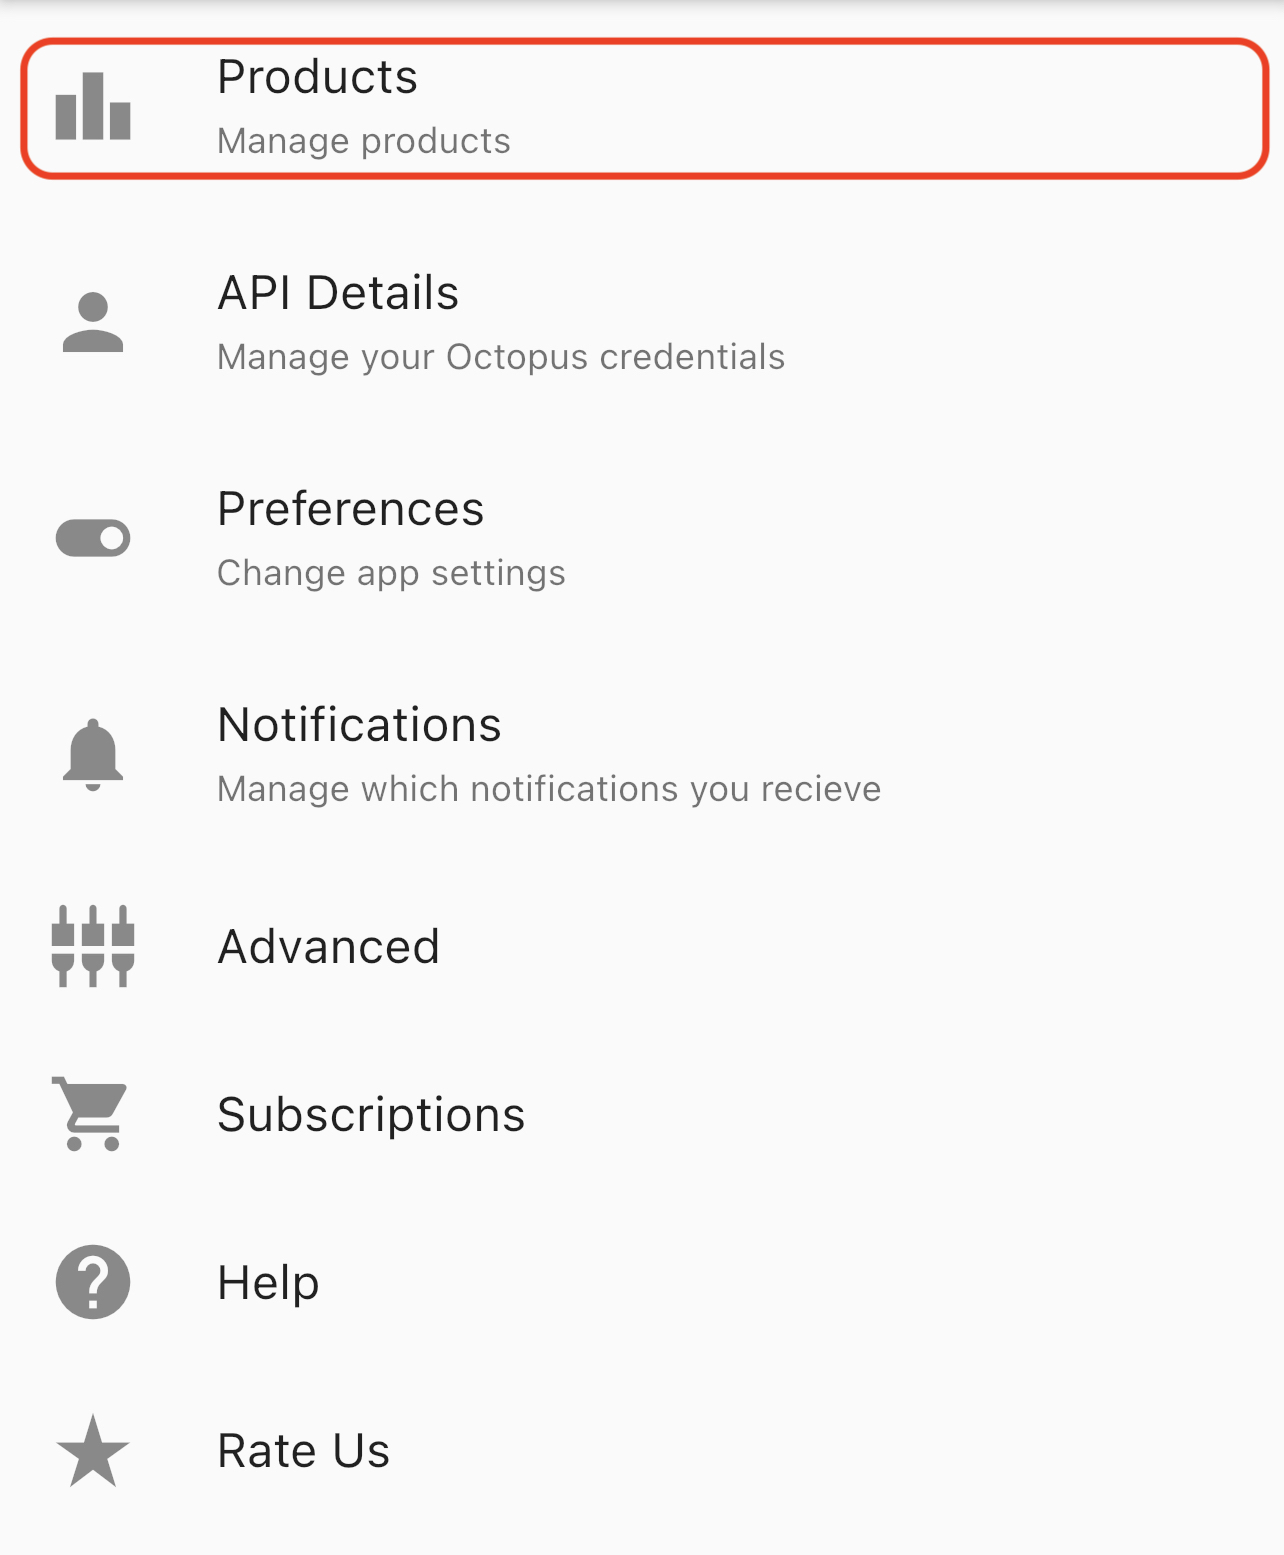
2. Click Custom Tariffs
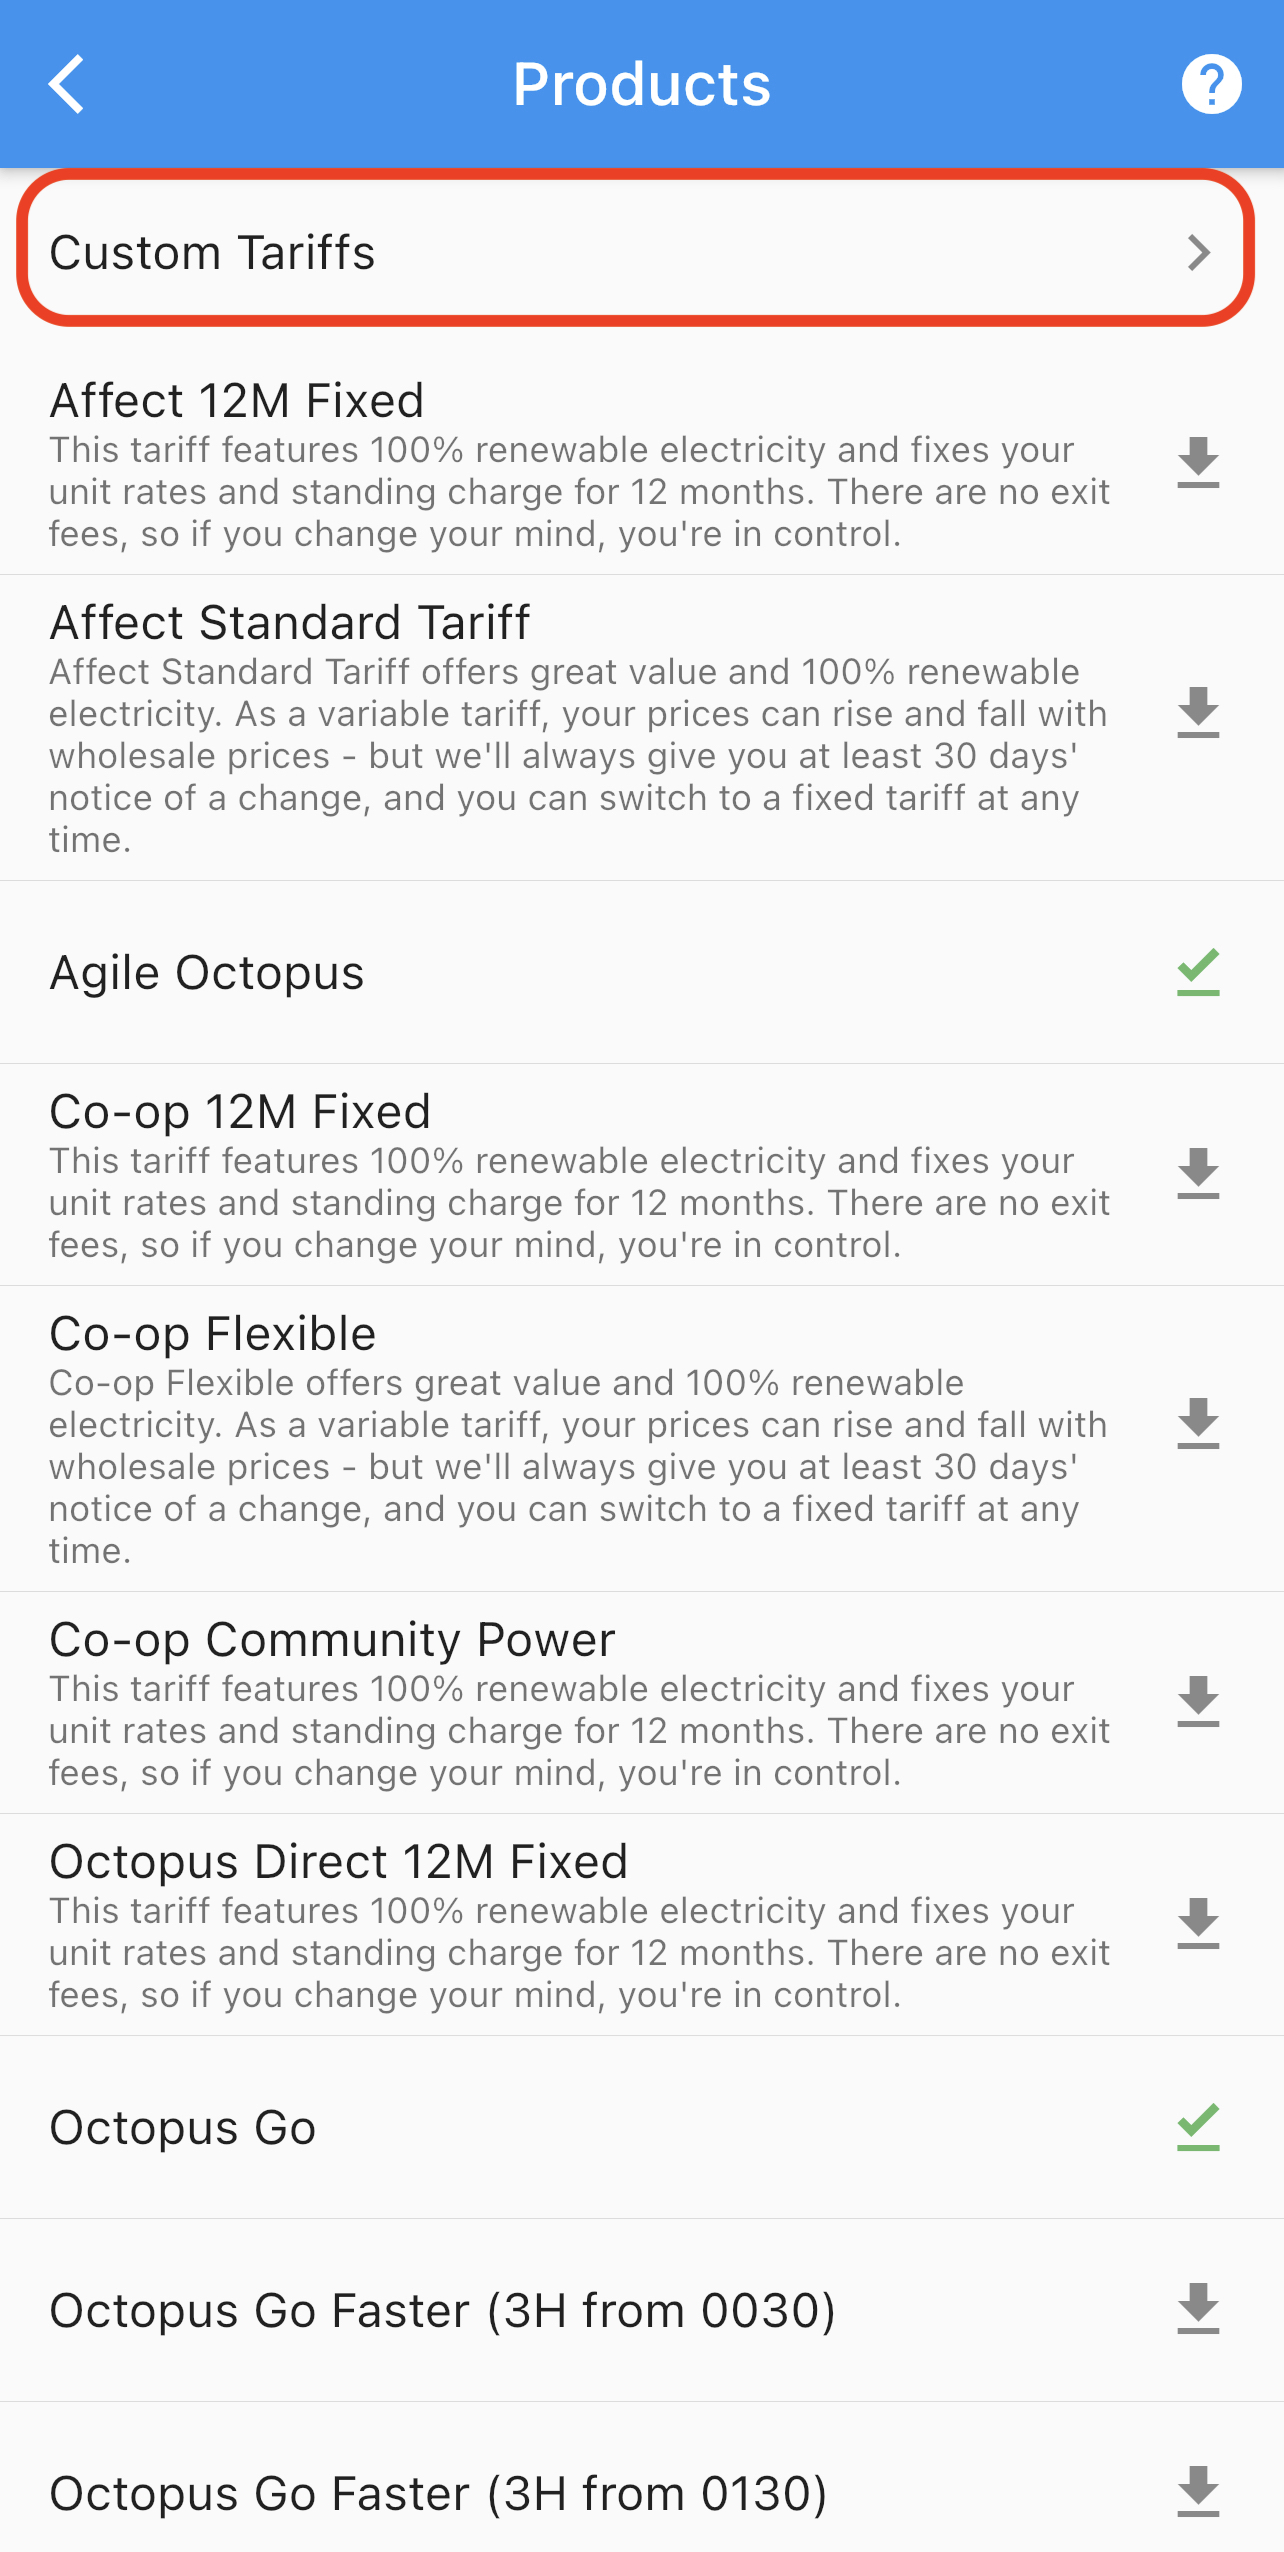
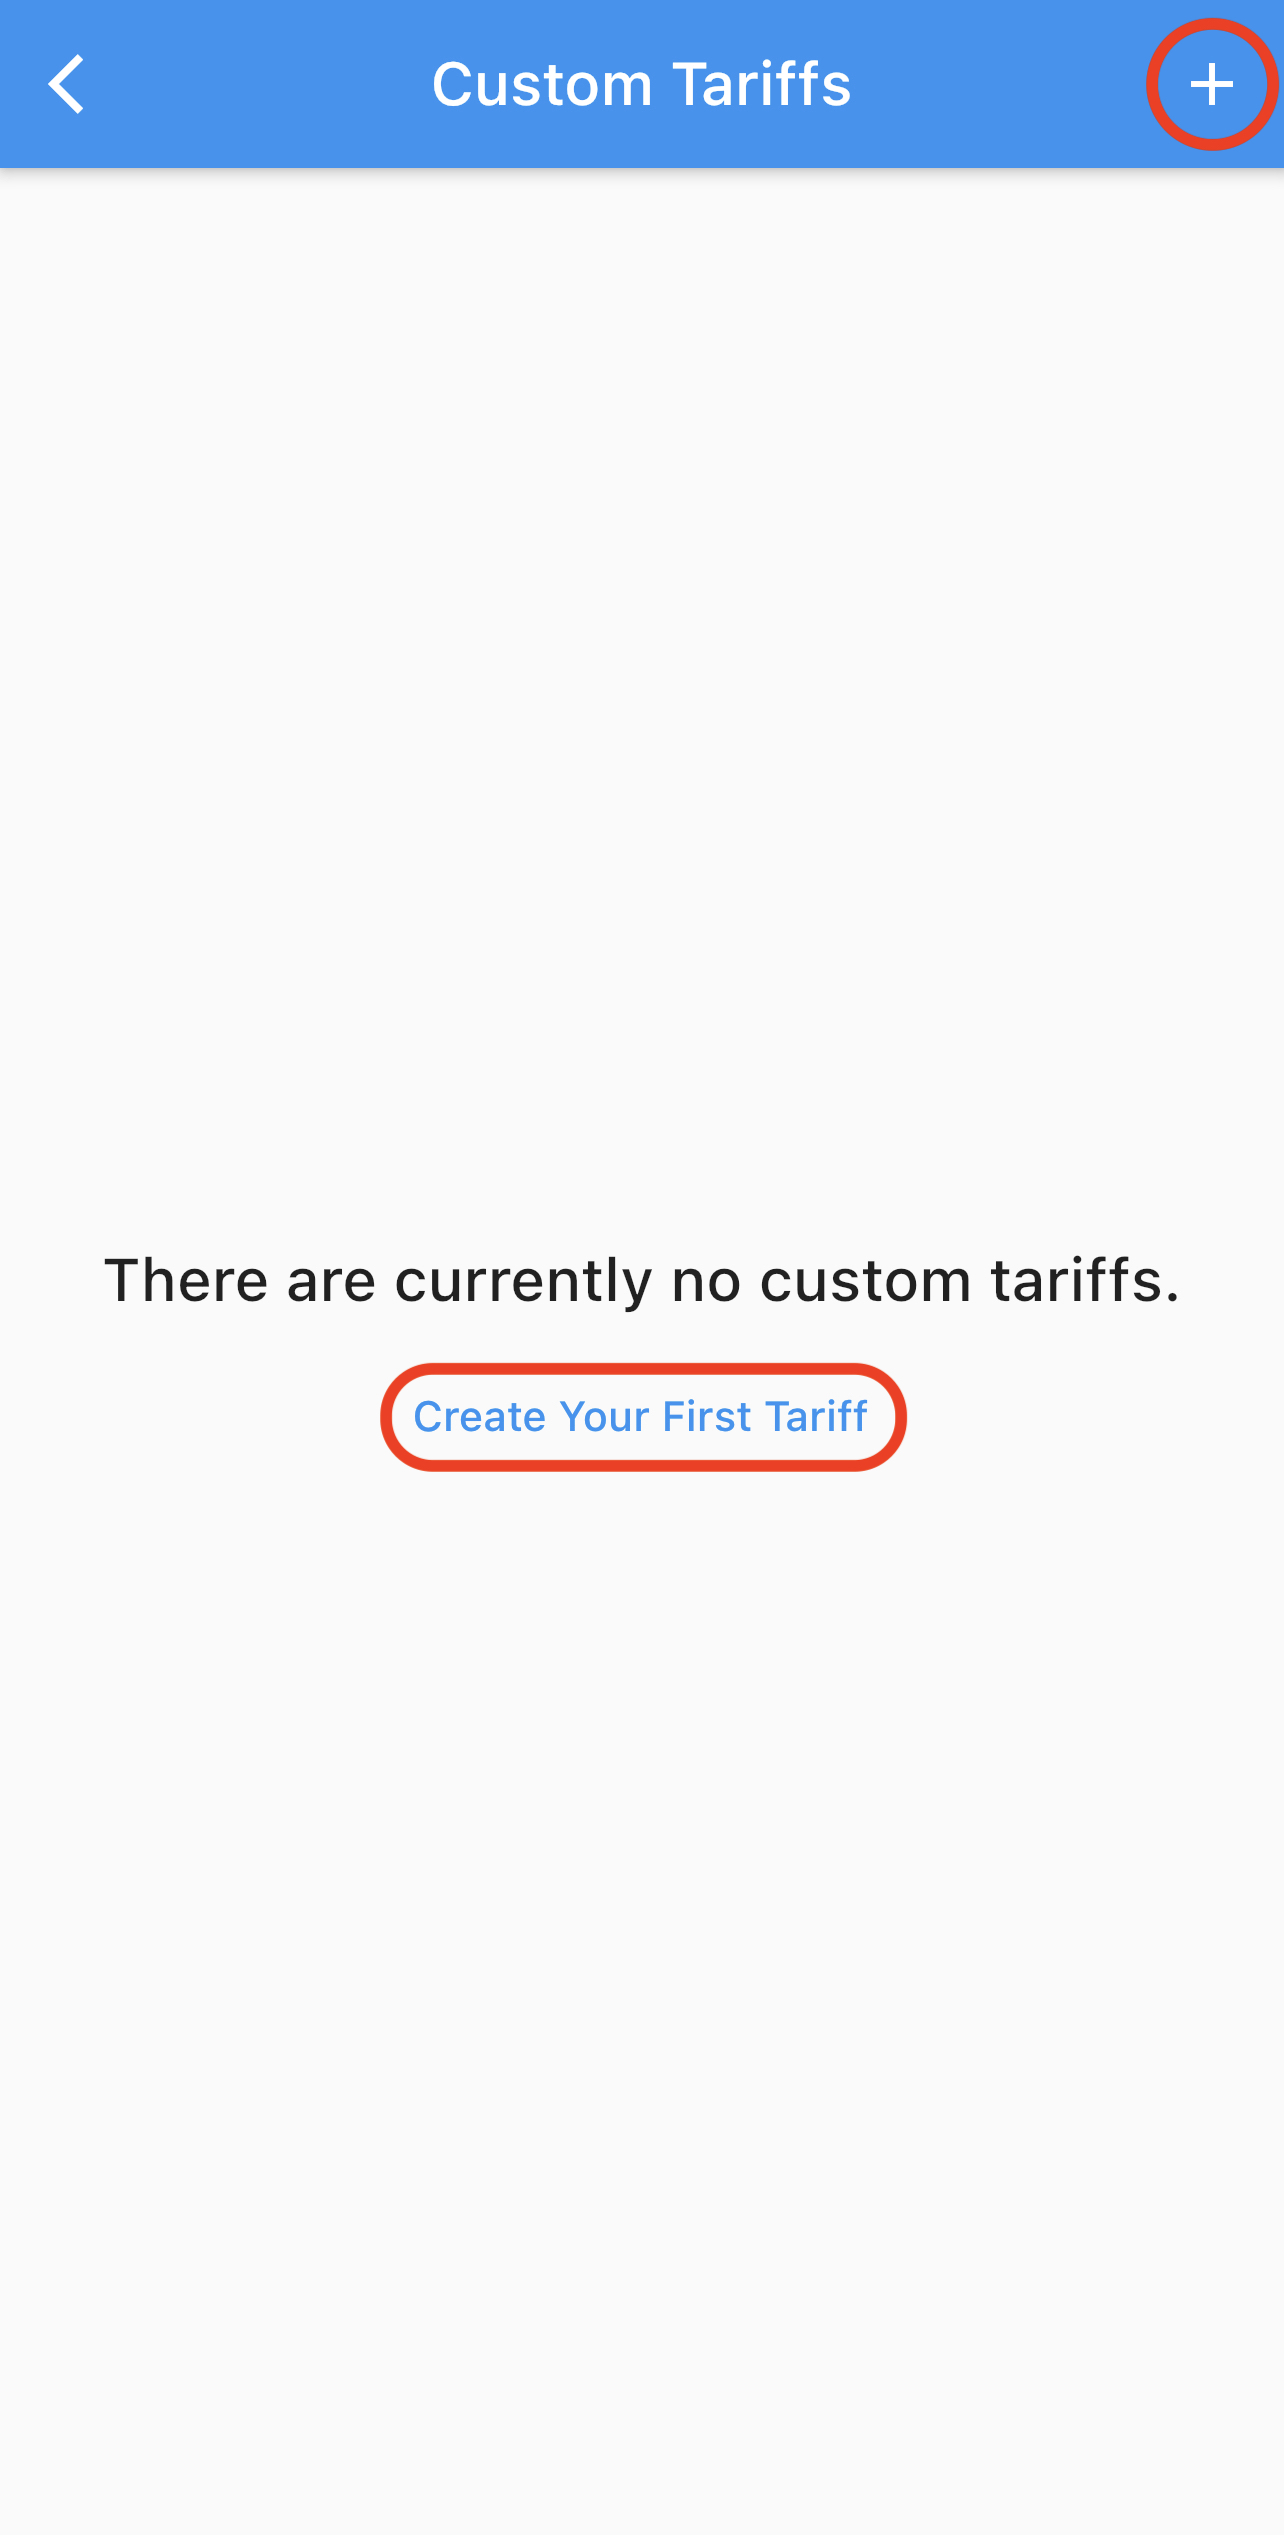
3. You will be presented with a button to Create Your First Tariff if you haven't created one before, otherwise you can use the + button in the top right
4. Once clicked, you will have access to the creation form. You will need to know the Standing Charge (in pence) and hourly unit rate (in p/kWh) for the tariff you're creating.

Tip: You can use the blue 'down fill' arrows on the right to set all fields lower than the selected arrow to the value of the field next to the selected value. This can significantly speed up your tariff creation process.
5. Finally, click Save. If you encounter an error, please first attempt to 'Refresh all data' in Settings --> Advanced. If you continue to face this issue, please get in contact with us using our contact form.
Once completed, you can return to the Compare page and select your custom tariff as you would with any other product - see 'Changing Comparison Products' for more information.
Editing/Deleting Your Tariff
If you need to edit your tariff, you can simply select the tariff again in the Custom Tariff list and you will be presented with the same form as before with all the current values for your tariff. Edit the values you would like to change and click Save.
To delete a tariff, you can swipe left on the tariff you would like to remove, and select Delete.

(Pro) Consumption Shifting
We are really excited for what this feature will bring, but please know that the feature is still actively being improved and figures shown are for illustration purposes.
Consumption shifting is a great and more fair way to compare tariffs as you are likely to shift your consumption depending on the your currently active tariff. For example, if you are an Octopus Go or Go Faster customer, you are likely to shift all your usage - especially EV charging - into the cheaper periods overnight so you avoid paying 15 p/kWh during the day.
Compare this to if you were on Octopus Agile, you could have a cheaper morning, or even plunge pricing part way through a day and you would aim to increase your consumption during this time.
What's the solution? There's not one perfect solution, as everyone's usage varies and some high peaks of usage are sometimes unavoidable, but we can get a pretty fair estimate by shifting your consumption as a perfect case. Octopus Compare does this automatically for you once switched into Consumption Shifting mode - using different figures calculated based on your consumption and tweaked using the settings provided to you, we'll automatically move your consumption to give you a more fair price for any selected tariff.
Toggling Consumption Shifting
You can toggle Consumption Shifting on or off at any time when you go to select the products you would like to compare (see Changing Comparison Products)

Once turned on, you can select your product you would like to shift and one you would like to compare it to. Currently only the first product is shifted and the second product is there for reference. We recommend setting the first product to be a product you're not currently on and the second to be the tariff you are currently on. You have the option to select the same product twice if you would like to see if your usage shifted and unshifted to see if you're currently shifting your usage in the most cost efficient way.
Once you're ready, simply select 'Shift Consumption'. This will compute your shifted price and set the app to use Consumption Shifting by default. You can view previous days, create ranges and anything else you would usually compare.
What Is The Graph Showing
Similar to the Compare graph, the Consumption Shifting graph shows your consumption and the tariff price but goes further to overlay other important metrics such as your minimum baseload threshold (the smallest consumption figure that can be shifted) and the original consumption before being shifted. This allows you to more easily visualise what has been shifted and where to.
If you would like to see the raw figures you can still achieve this by viewing the table - the consumption shown is post-shifted.
Configuring Consumption Shifting
We built Consumption Shifting so that you can configure it to suit your usage and make the results more useful.
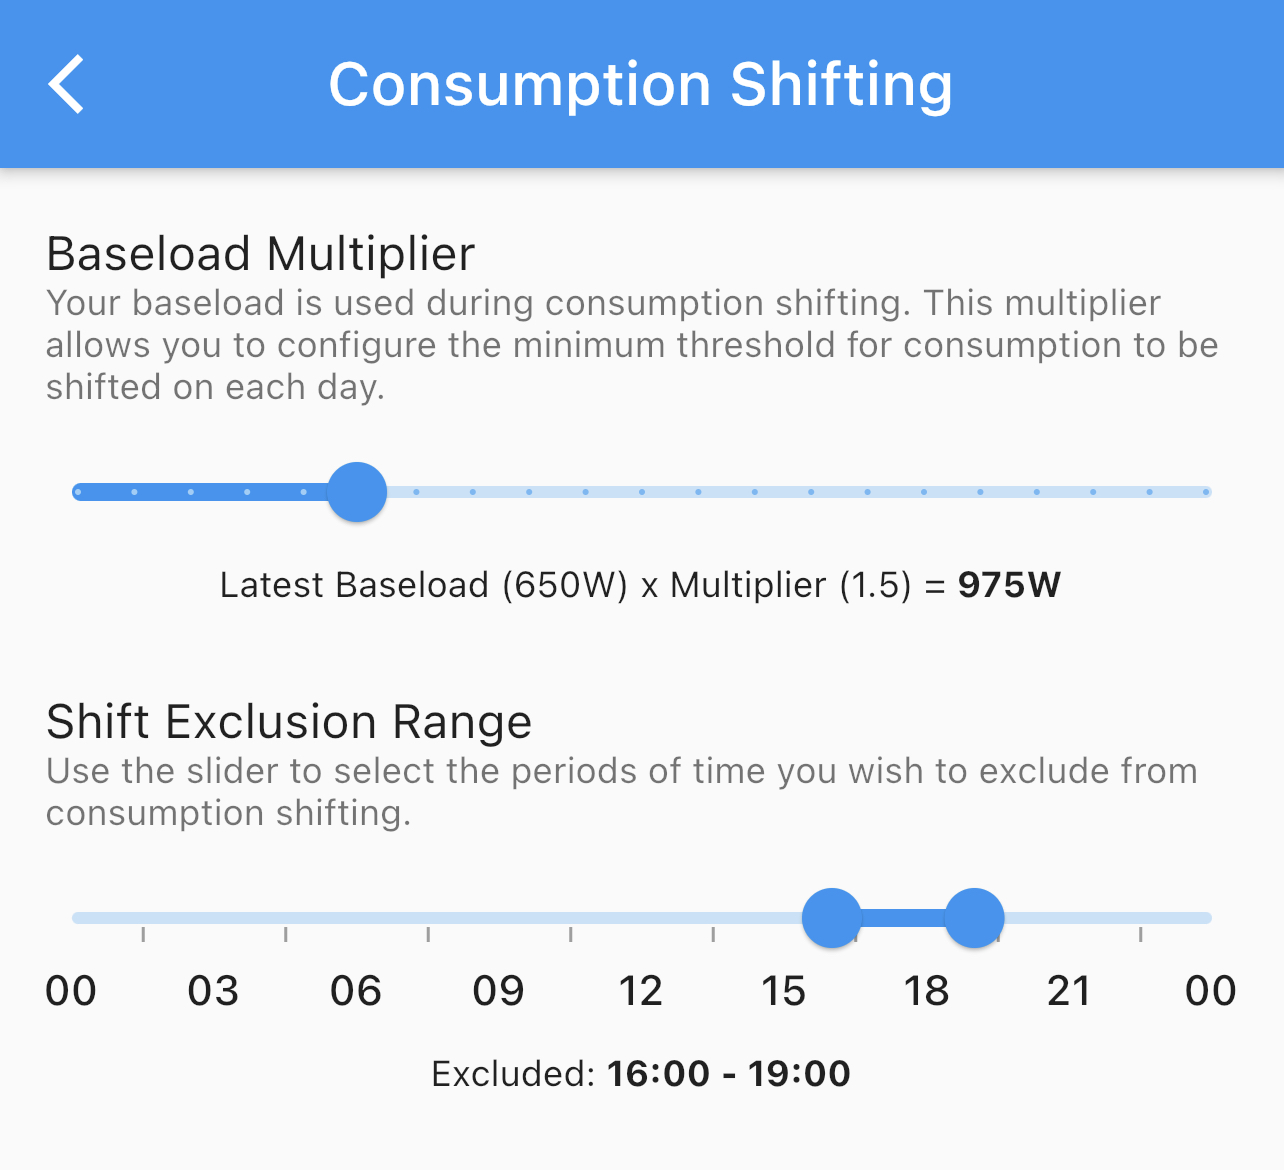
Baseload Multiplier
We use your baseload to calculate which consumption points can be shifted at any one time. This means that your general usage of electrical items such as lights or other appliances that cannot be avoided are not shifted. We found from testing, multiplying this number by 1.5 creates a good balance to ensure large peaks are moved.
You may want the shifting to be more or less sensitive based on your needs and therefore you can change this value using the slider. We have included a dynamic example below the slider to show what the minimum shifted value would be based on your usage the day before, but the final figure will be slightly different for each day.
Defaults to 1.5
We recommend you try different figures to find the best balance. Setting this multiplier to 1 can be beneficial if you don't often have large peaks of usage.
Shift Exclusion Range
Some usage typically shouldn't be shifted, especially around times where you cannot avoid using electric. This will be different for everyone and therefore we allow you to configure this dependant on your needs. You may prepare and cook between the peak times of 16:00 - 19:00 using an electric cooker and it's unlikely that you can shift this, therefore you should exclude this time so that Octopus Compare doesn't move your consumption.
Defaults to 16:00 - 19:00 as this is peak time and often usage between this time is unavoidable
Roadmap
As mentioned above, Consumption Shifting is a Beta feature and is subject to change between versions. We will be listening heavily to feedback to help improve the accuracy, reliability and efficiency of this feature.